library("tinyplot")
# "ellipse" type convenience character string
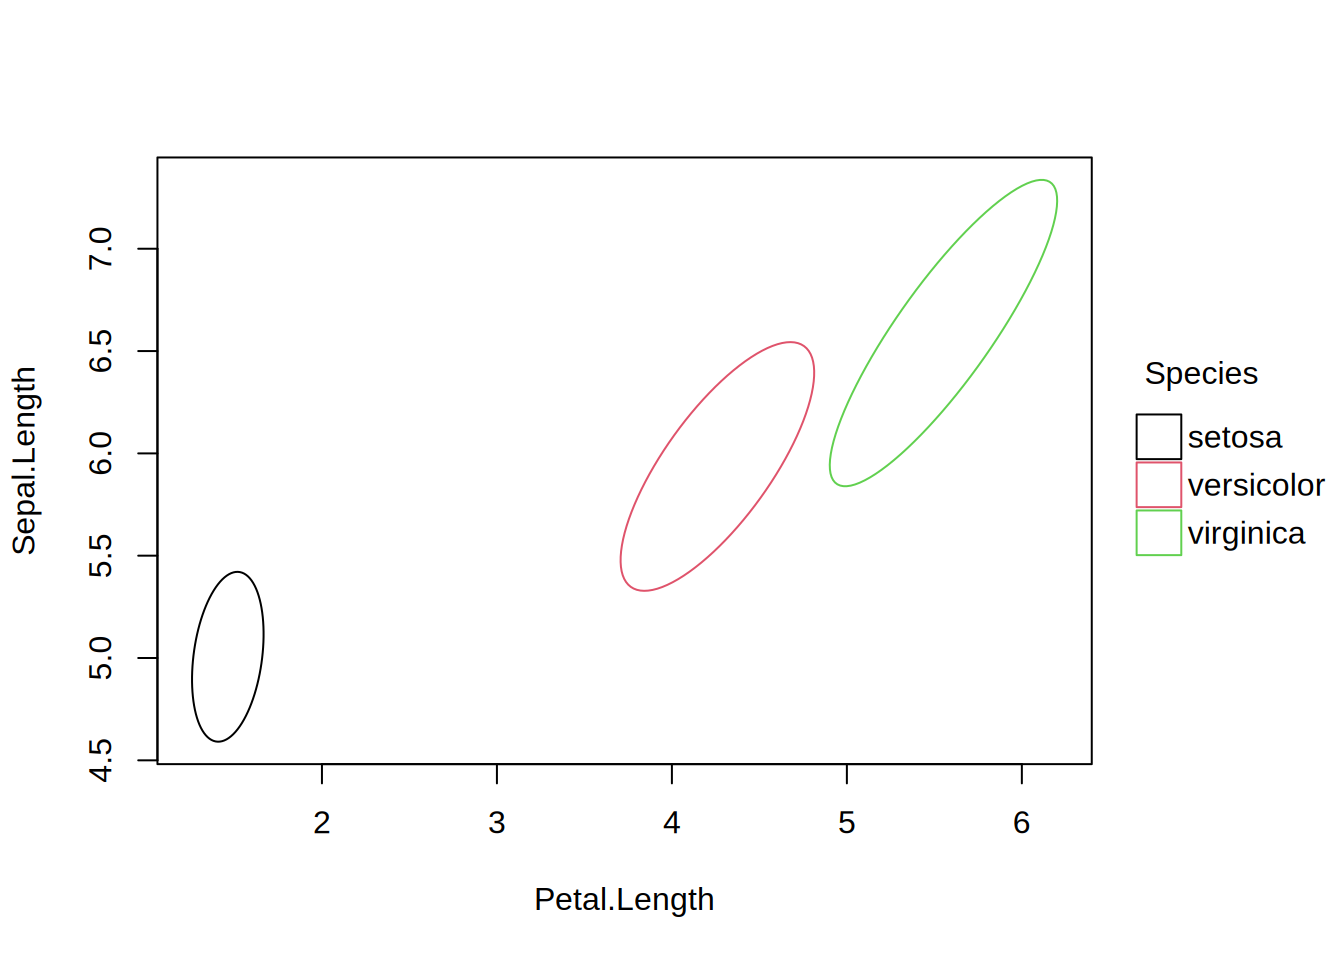
tinyplot(Sepal.Length ~ Petal.Length | Species, data = iris, type = "ellipse")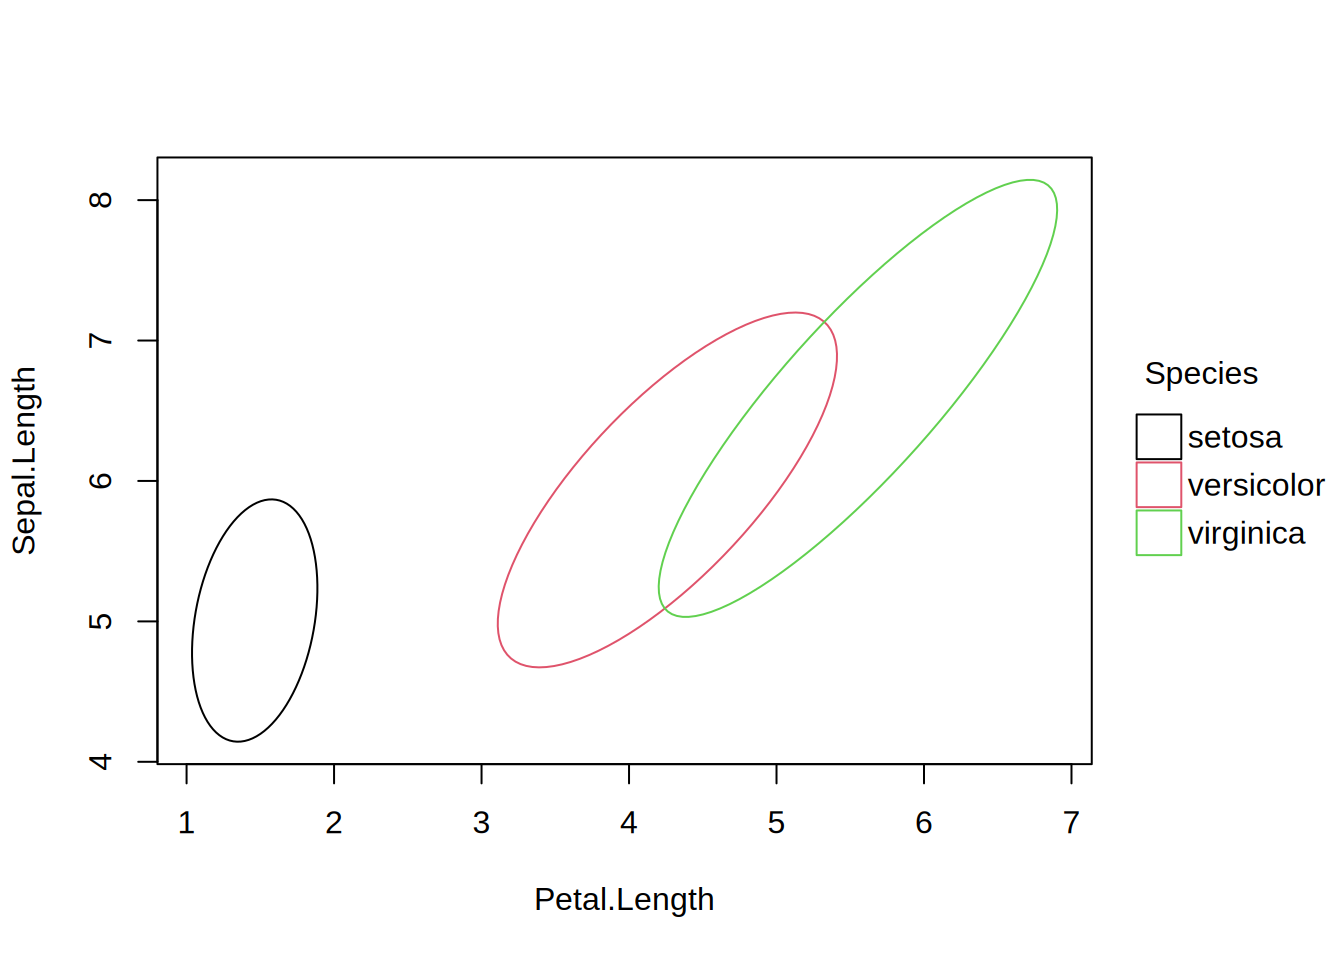
# layer filled ellipse(s) on top of points
tinyplot(Sepal.Length ~ Petal.Length | Species, data = iris, theme = "basic")
tinyplot_add(type = "ellipse", fill = 0.2)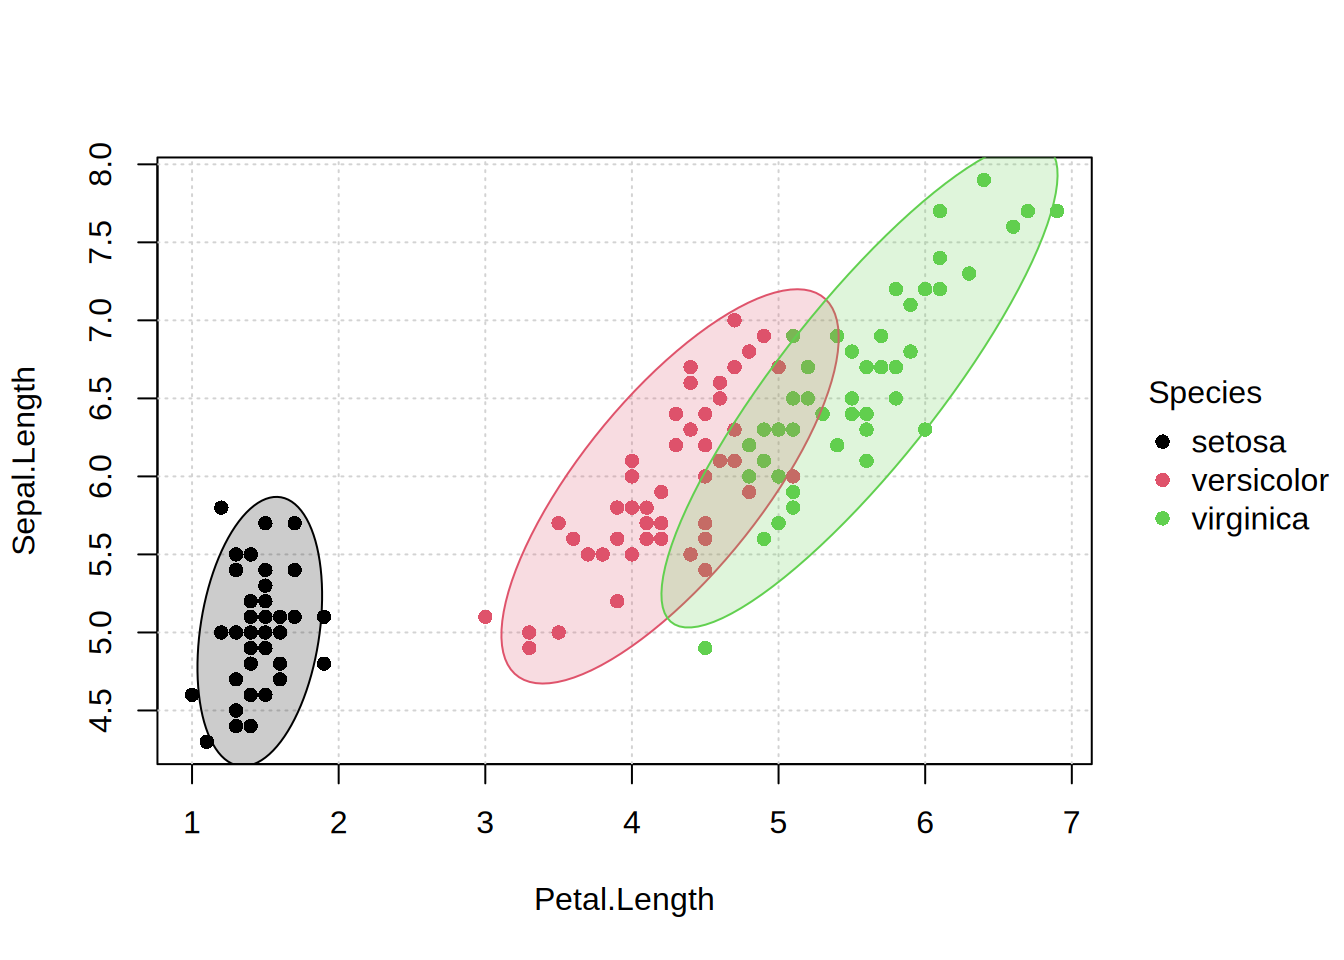
# to avoid clipping, it's better to reverse the layering (ellipse first)
tinyplot(Sepal.Length ~ Petal.Length | Species, data = iris, theme = "basic",
         type = "ellipse", fill = 0.2)
tinyplot_add(type = "p")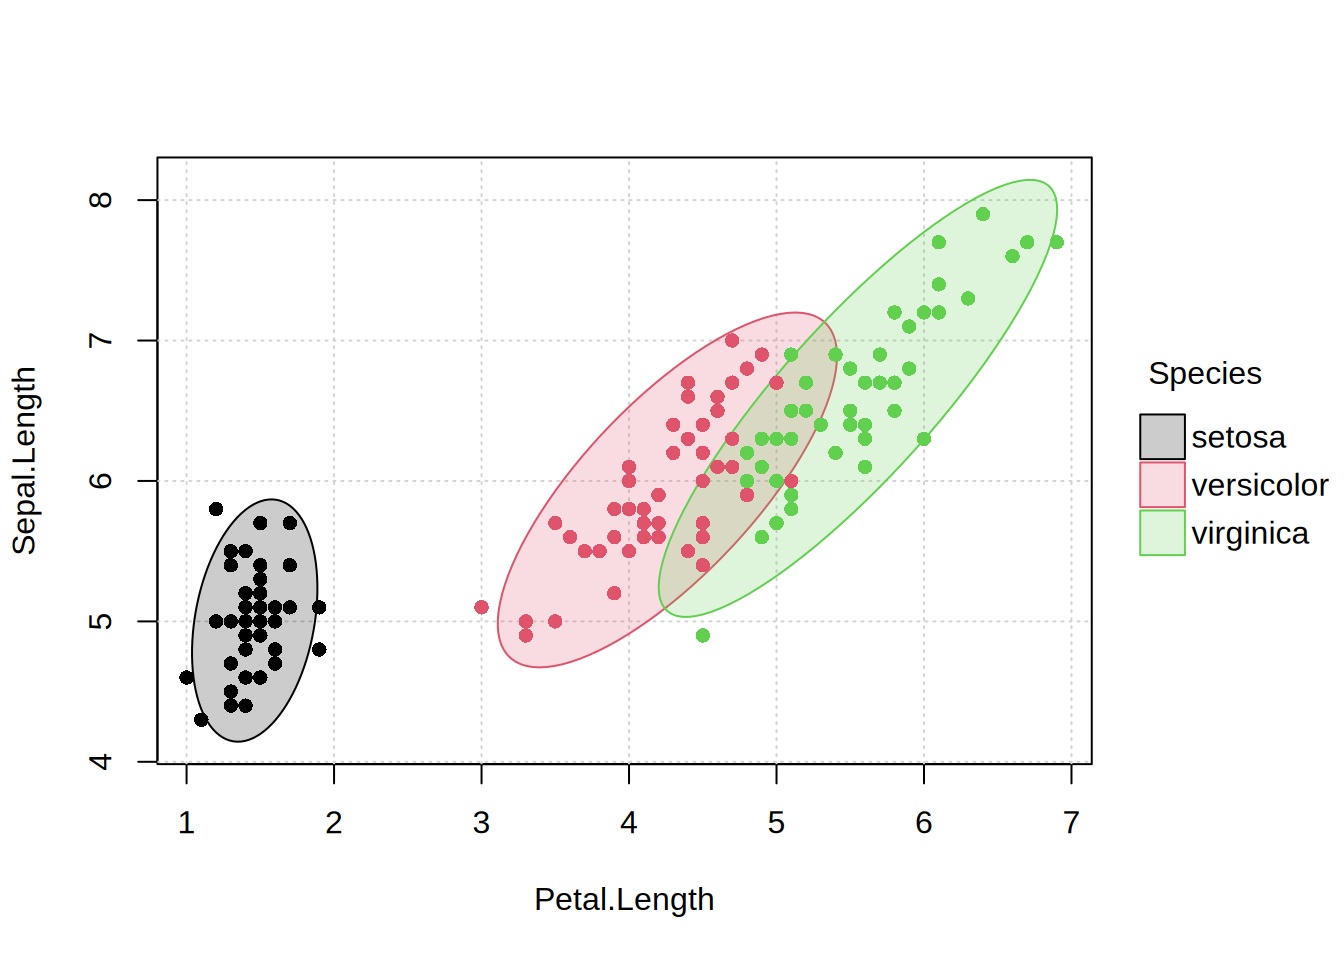
# custom confidence level
tinyplot(Sepal.Length ~ Petal.Length | Species, data = iris,
  type = type_ellipse(level = 0.5))