library("tinyplot")
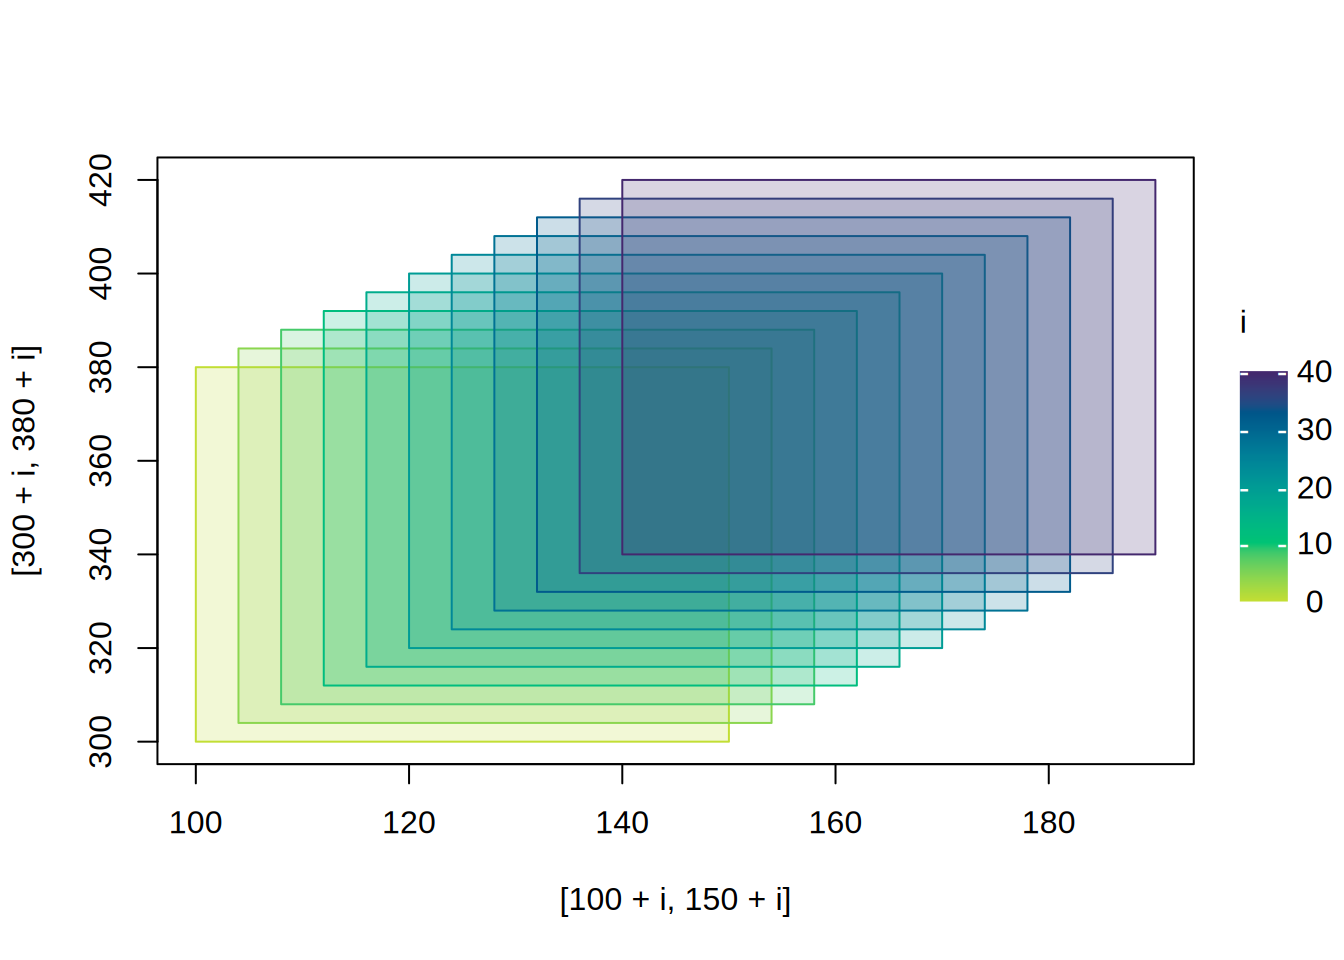
i = 4*(0:10)
# "rect" type convenience character string
tinyplot(
xmin = 100+i, ymin = 300+i, xmax = 150+i, ymax = 380+i,
by = i, fill = 0.2,
type = "rect"
)
# Same result with type_rect()
tinyplot(
  xmin = 100+i, ymin = 300+i, xmax = 150+i, ymax = 380+i,
  by = i, fill = 0.2,
  type = type_rect()
)