library("tinyplot")

# "p" type convenience character string
tinyplot(Sepal.Length ~ Petal.Length, data = iris, type = "p")
# Same result with type_points()
tinyplot(Sepal.Length ~ Petal.Length, data = iris, type = type_points())

# Note: Specifying the type here is redundant. Like base plot, tinyplot
# automatically produces a scatter plot if x and y are numeric
tinyplot(Sepal.Length ~ Petal.Length, data = iris)

# Grouped scatter plot example
tinyplot(Sepal.Length ~ Petal.Length | Species, data = iris)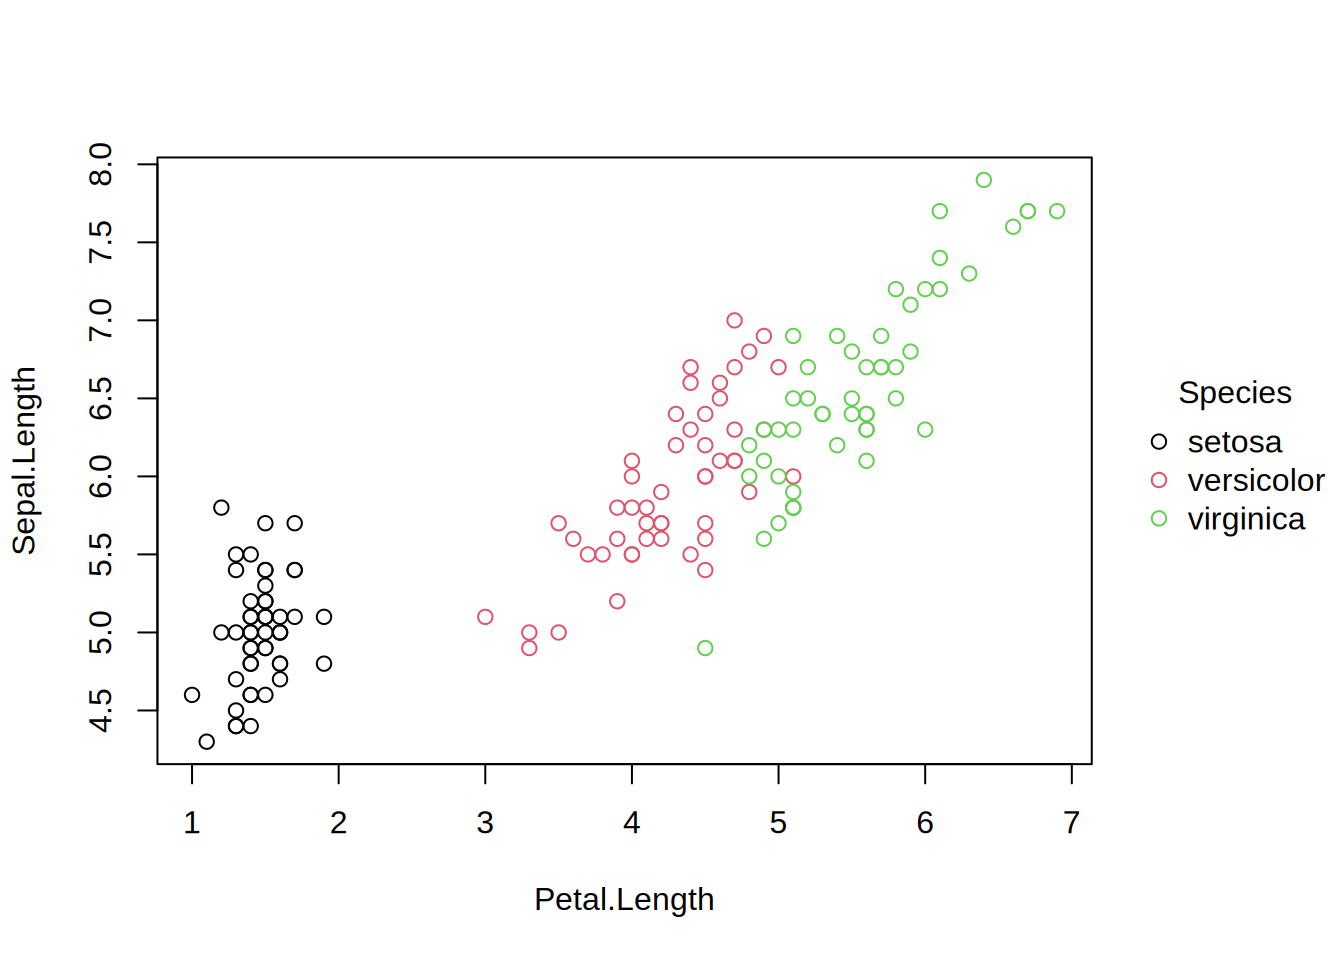
# Continuous grouping (with gradient legend)
tinyplot(Sepal.Length ~ Petal.Length | Sepal.Width, data = iris, pch = 19)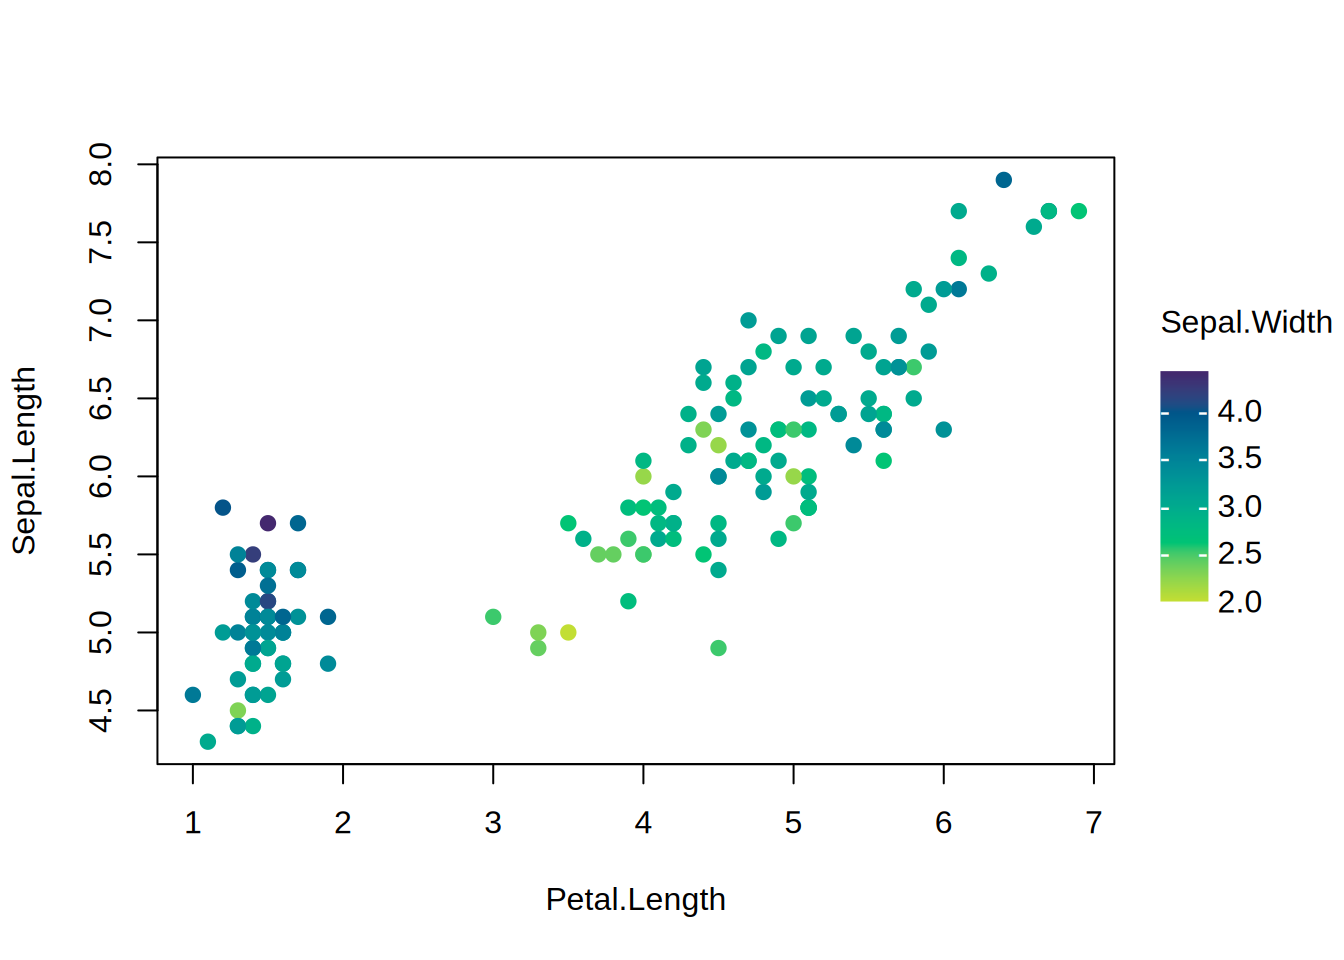
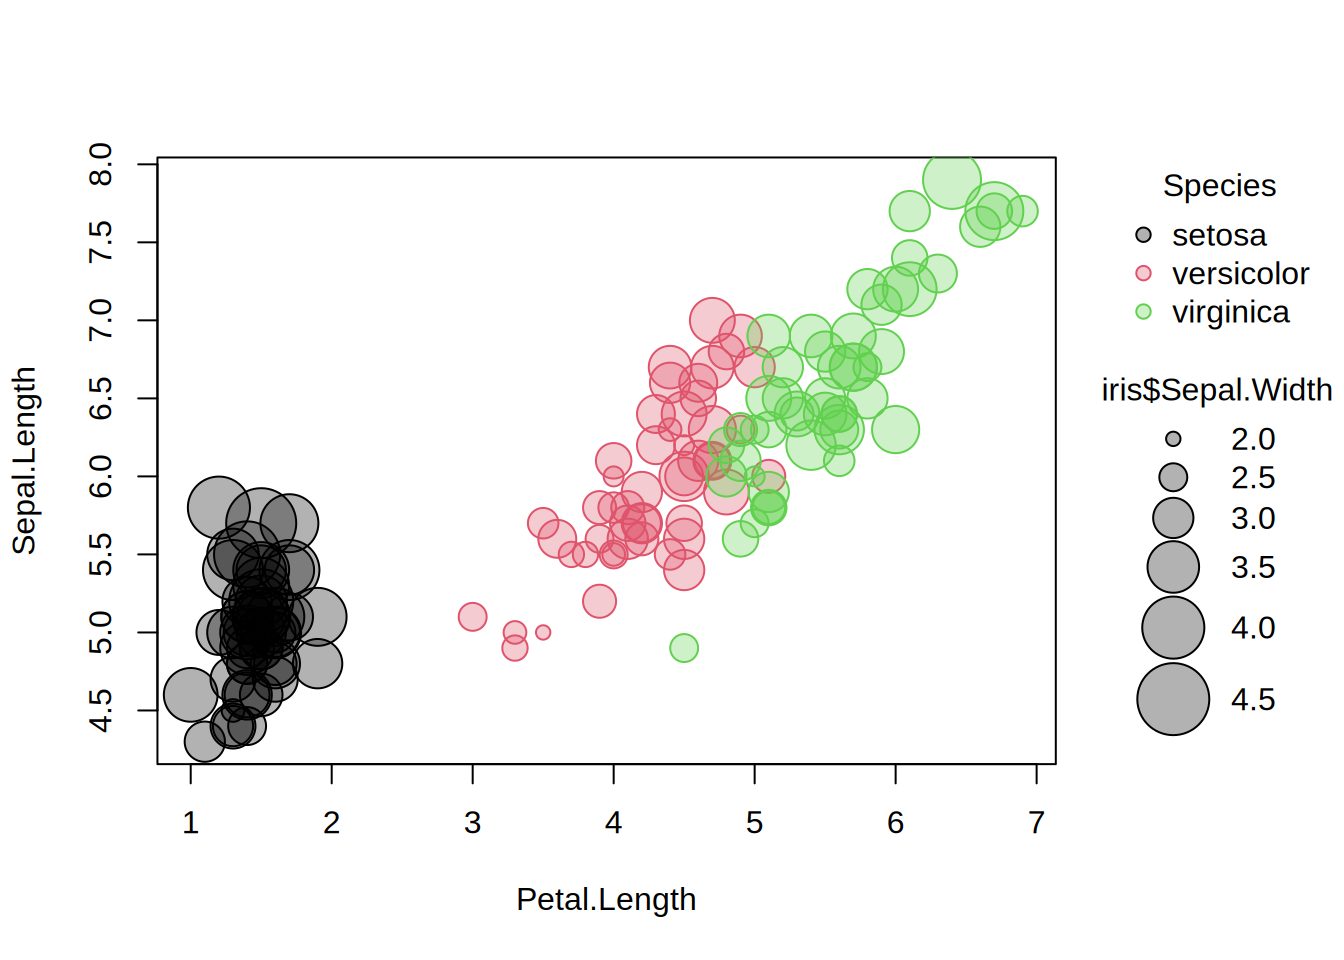
# Bubble chart version
tinyplot(Sepal.Length ~ Petal.Length, data = iris, cex = iris$Sepal.Width)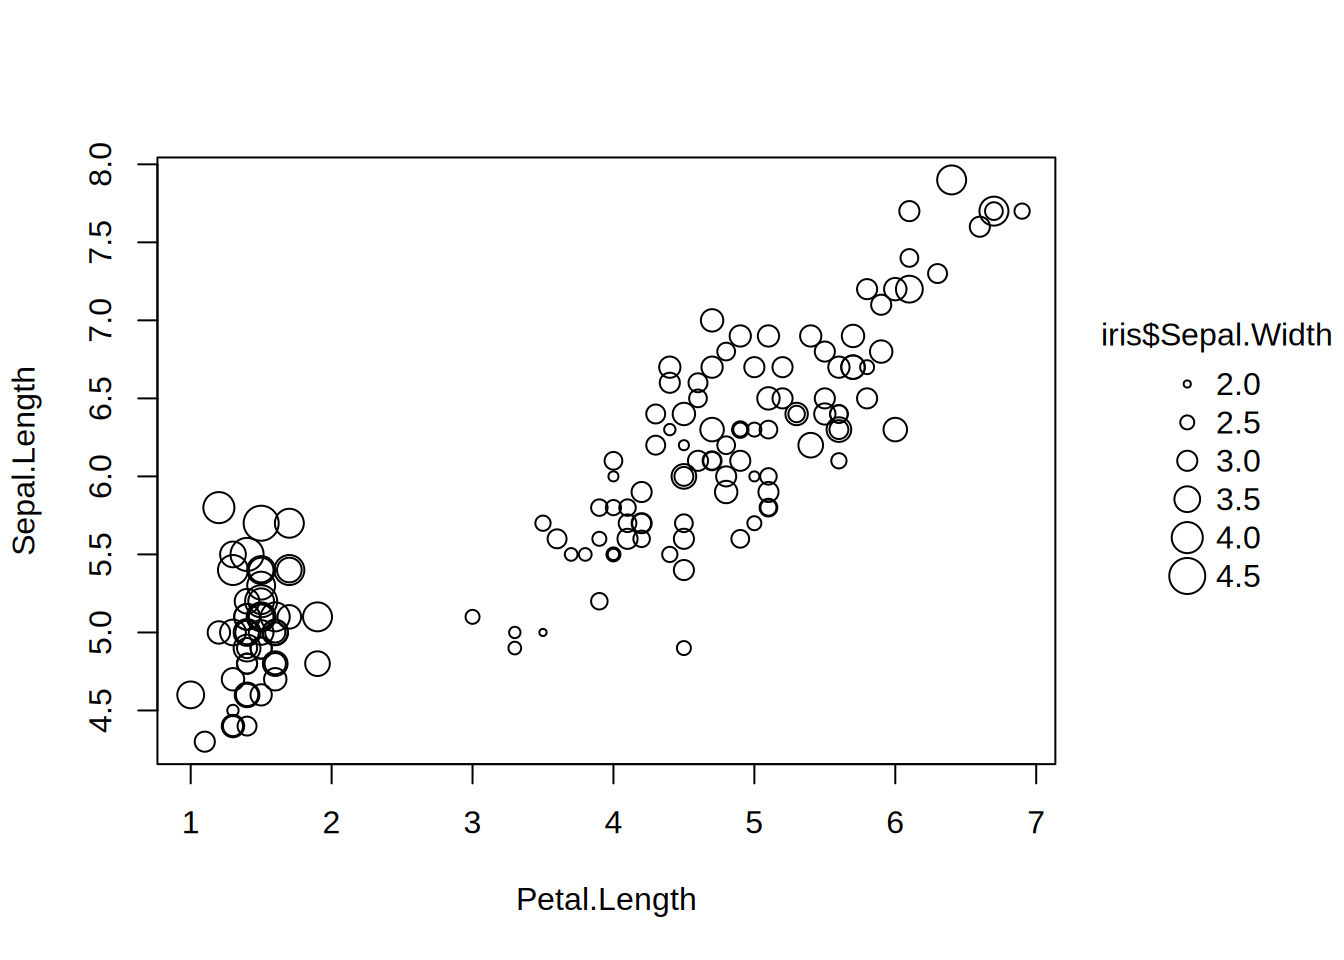
# Fancier version with dual legends and extra customization
tinyplot(Sepal.Length ~ Petal.Length | Species,
  data = iris,
  cex = iris$Sepal.Width, clim = c(1, 5),
  pch = 21, fill = 0.3)