library("tinyplot")

#
## abline

tinyplot(x = -10:10, y = rnorm(21) + -10:10, grid = TRUE)
tinyplot_add(type = "abline")
# same as...
# tinyplot_add(type = type_abline(a = 0, b = 1))

# customize by passing bespoke intercept and slope values
tinyplot_add(type = type_abline(a = -1, b = -0.5))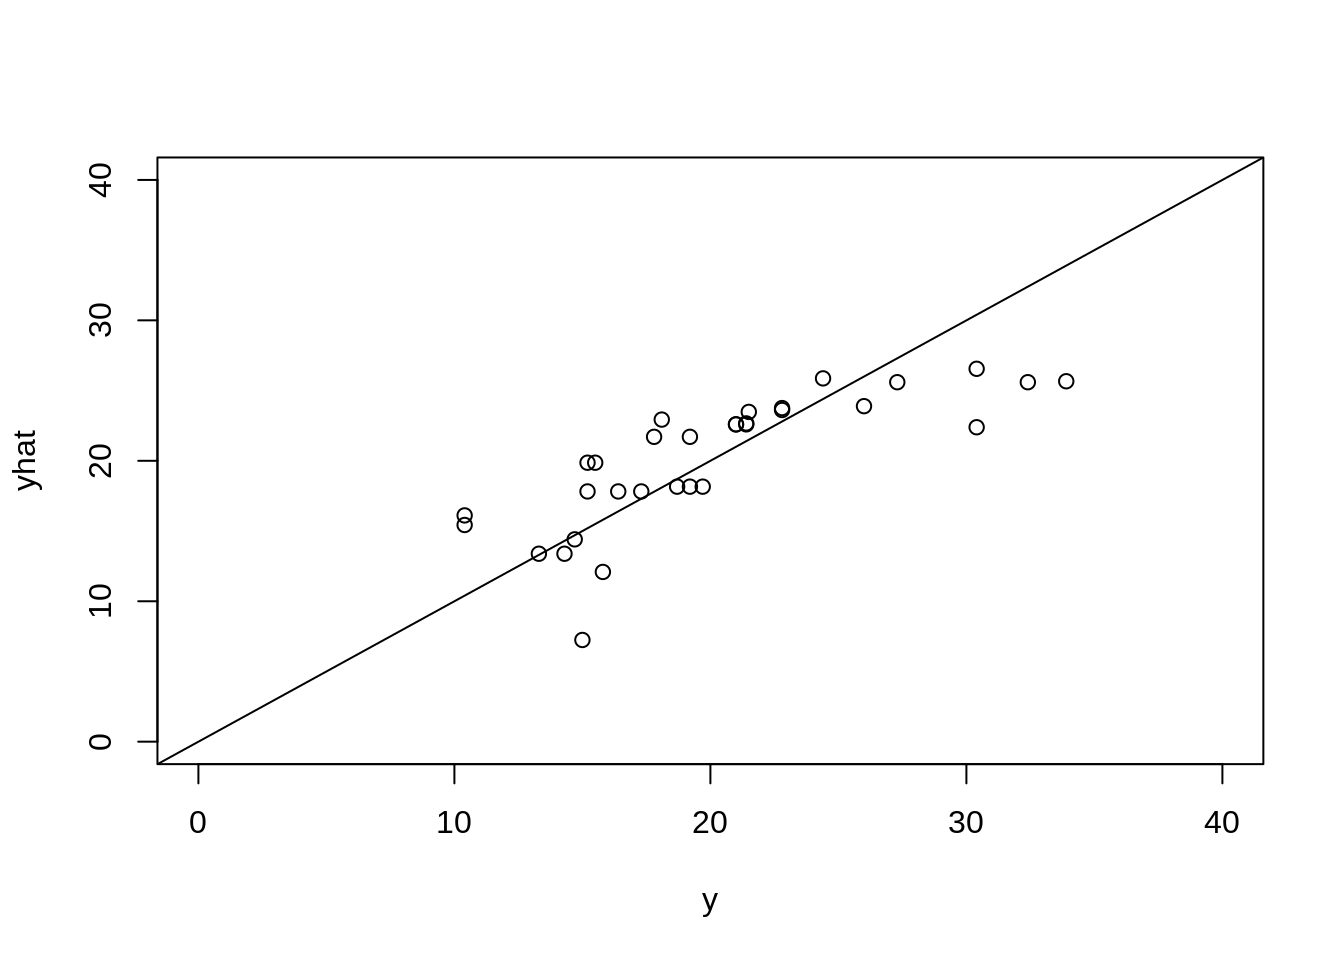
# note that calling as abline & co. as a base plot layer will still lead to
# axes limits that respect the range of the data
tinyplot(x = -10:10, y = -10:10, grid = TRUE, type = "abline")
#
## hline and vline

# Base plot layer
tinyplot(mpg ~ hp | cyl, facet = "by", data = mtcars, ylim = c(0, 40))

# Add horizontal lines at the (default) 0 y-intercept
tinyplot_add(type = "hline", col = "grey")

# Note that group+facet aesthetics will be inherited. We can use this to
# add customized lines (here: the mean `mpg` for each `cyl` group)
tinyplot_add(type = type_hline(with(mtcars, tapply(mpg, cyl, mean))), lty = 2)

# Similar idea for vline
tinyplot_add(type = type_vline(with(mtcars, tapply(hp, cyl, mean))), lty = 2)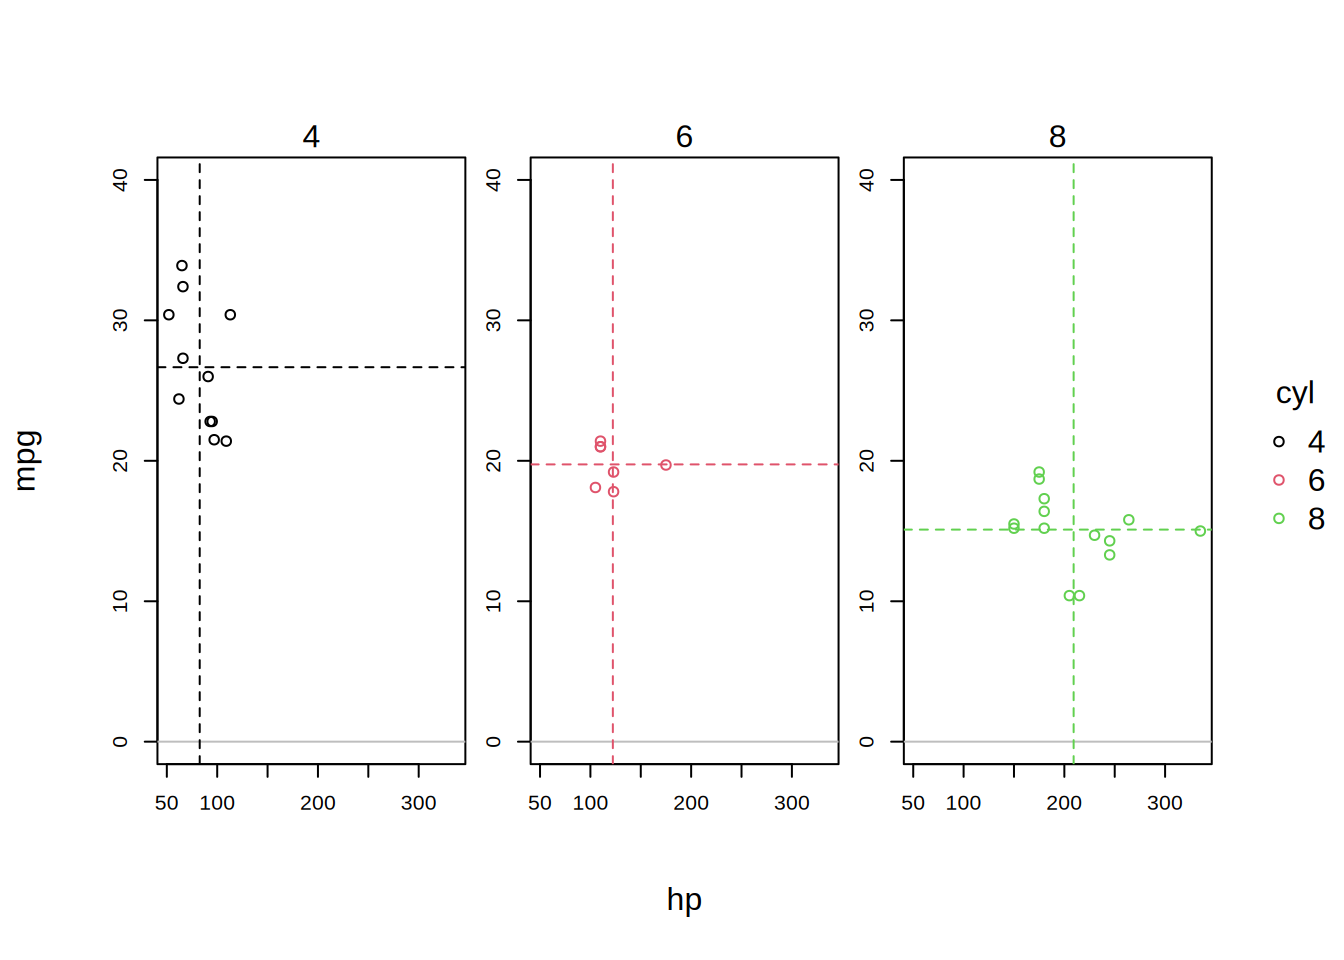
#
## Recycling logic

# length(h) == no. of groups
tinyplot(mpg ~ wt | factor(cyl), data = mtcars, type = type_hline(h = 21:23))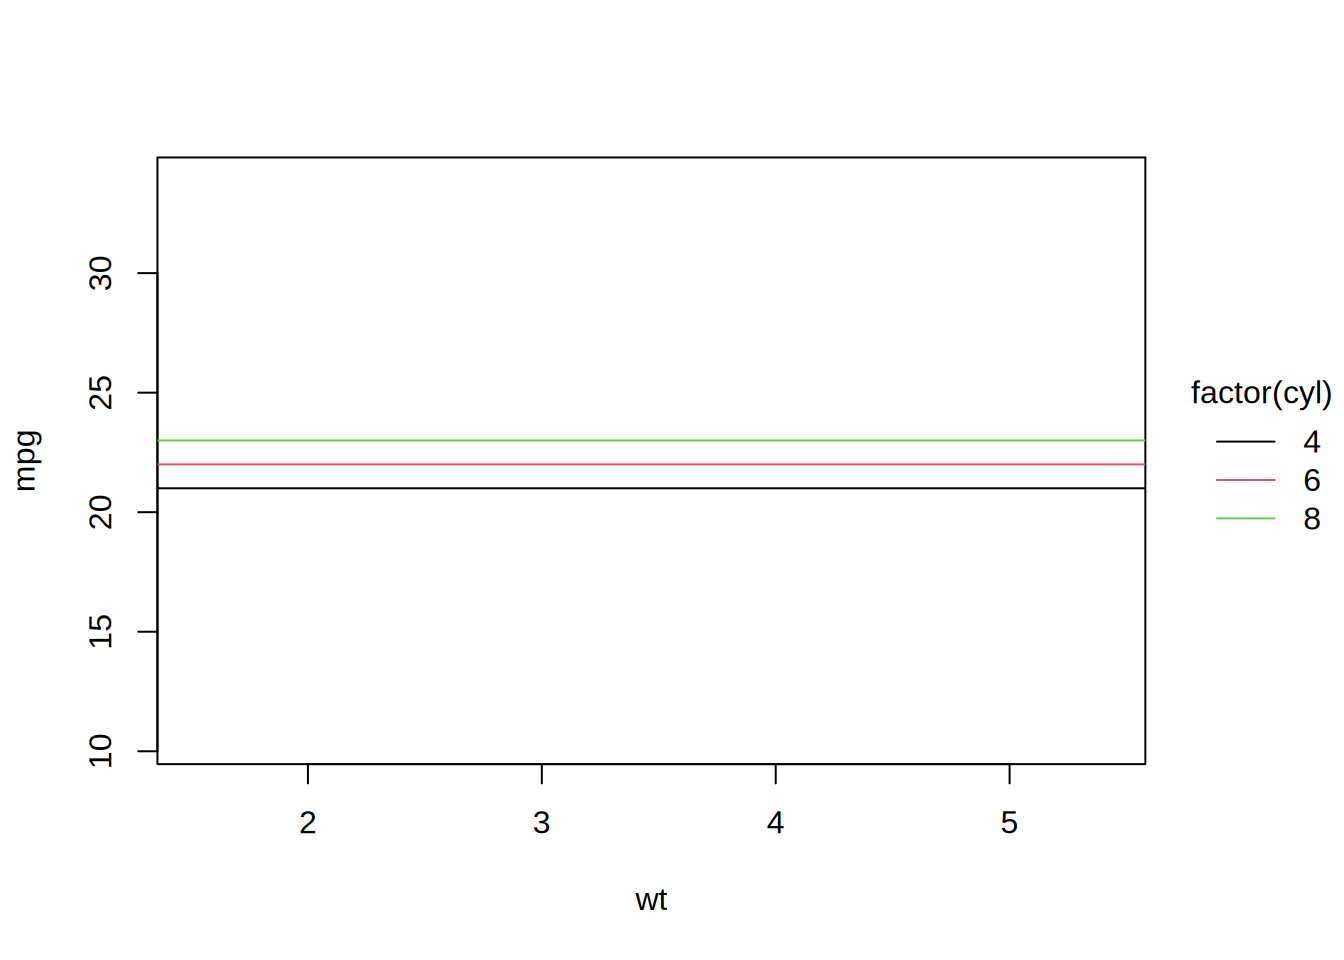
# length(h) == no. of facets
tinyplot(mpg ~ wt, facet = ~am, data = mtcars, type = type_hline(h = c(20, 30)))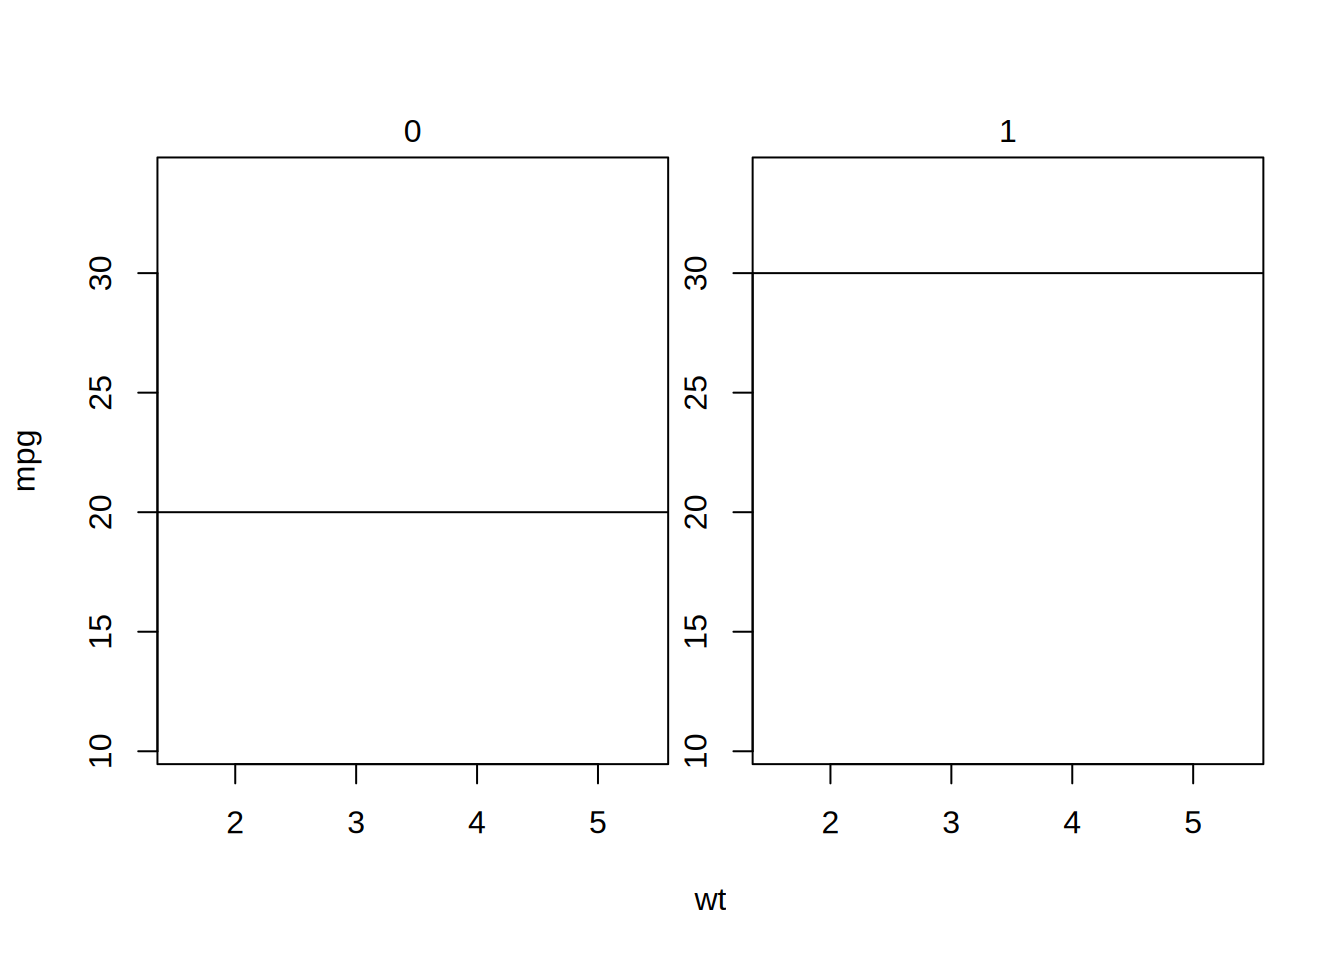
# length(h) == no. of groups x no. of facets
tinyplot(mpg ~ wt | factor(cyl),
  facet = ~am, data = mtcars,
  type = type_hline(h = 21:26))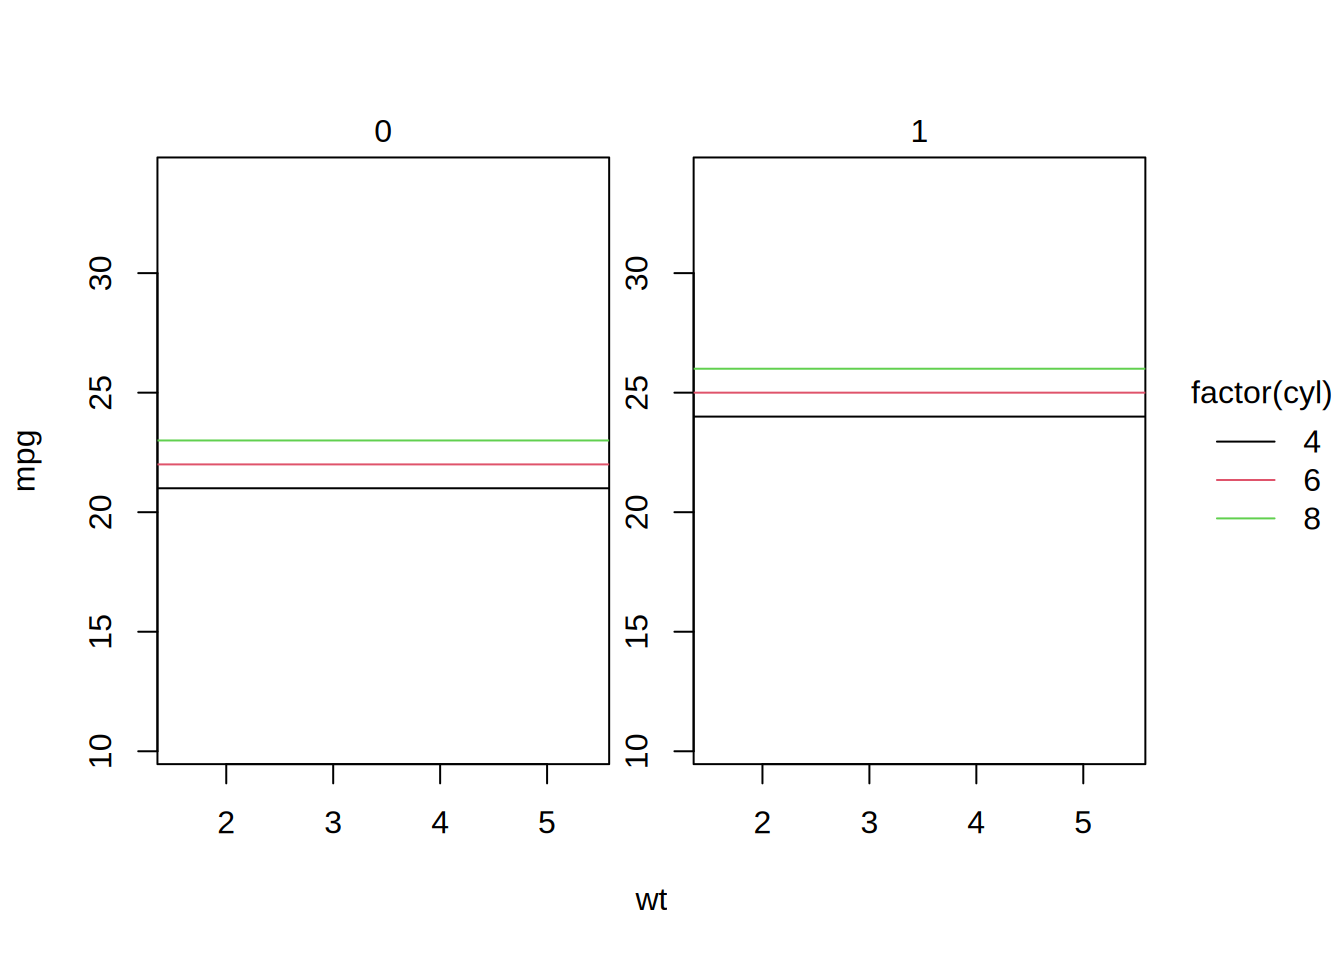
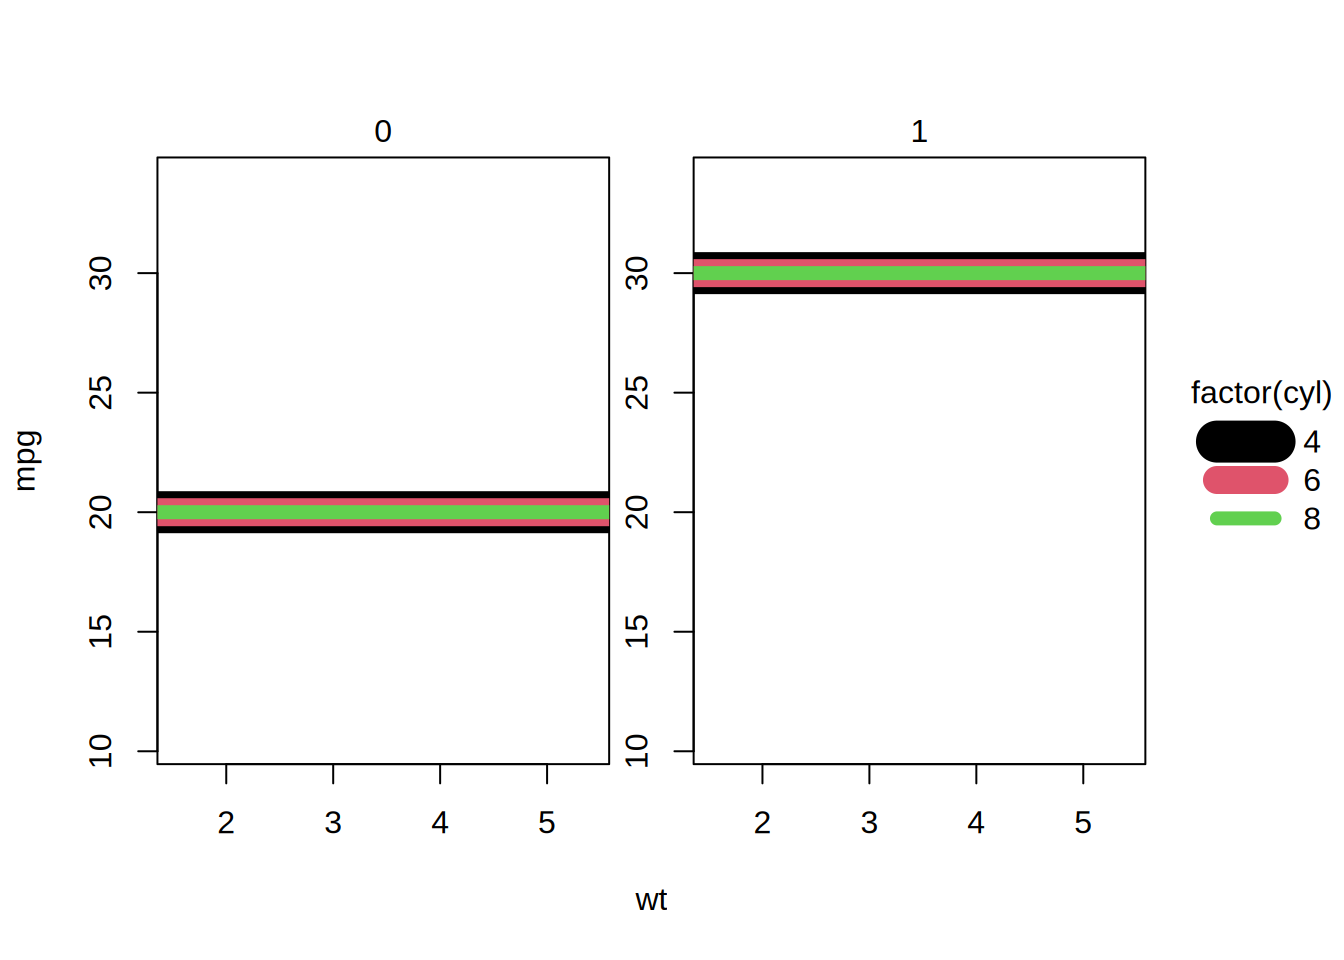
# special adjustment case (here: lwd by group)
tinyplot(mpg ~ wt | factor(cyl),
  facet = ~am, data = mtcars,
  type = type_hline(c(20, 30)), lwd = c(21, 14, 7))