breaks
|
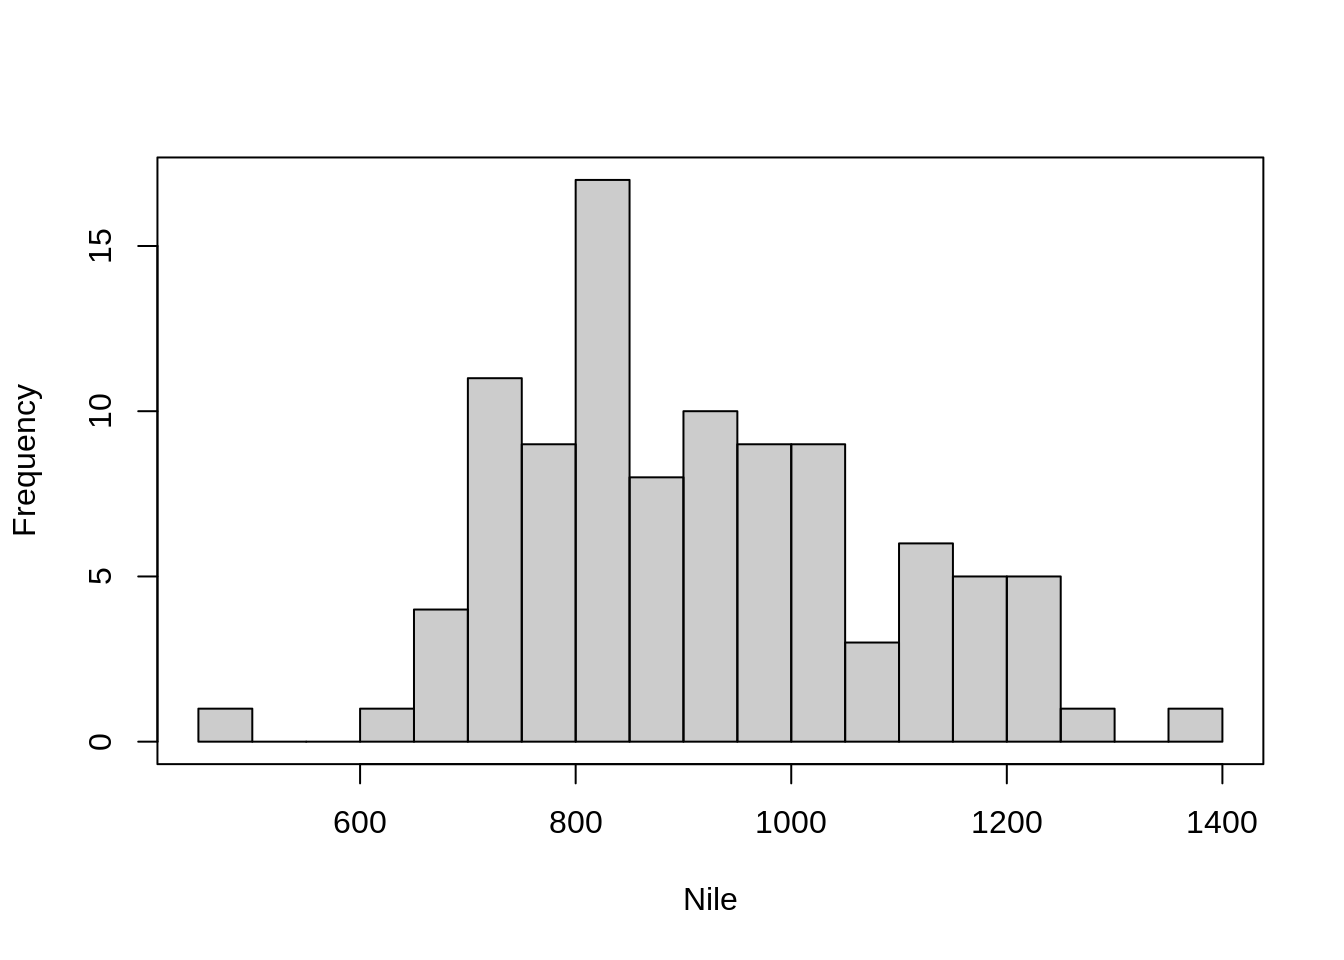
Passed to hist. One of:
-
a vector giving the breakpoints between histogram cells,
-
a function to compute the vector of breakpoints,
-
a single number giving the number of cells for the histogram,
-
a character string naming an algorithm to compute the number of cells (see ‘Details’ of hist),
-
a function to compute the number of cells. In the last three cases the number is a suggestion only; as the breakpoints will be set to pretty values, the number is limited to 1e6 (with a warning if it was larger). If breaks is a function, the x vector is supplied to it as the only argument (and the number of breaks is only limited by the amount of available memory).
|
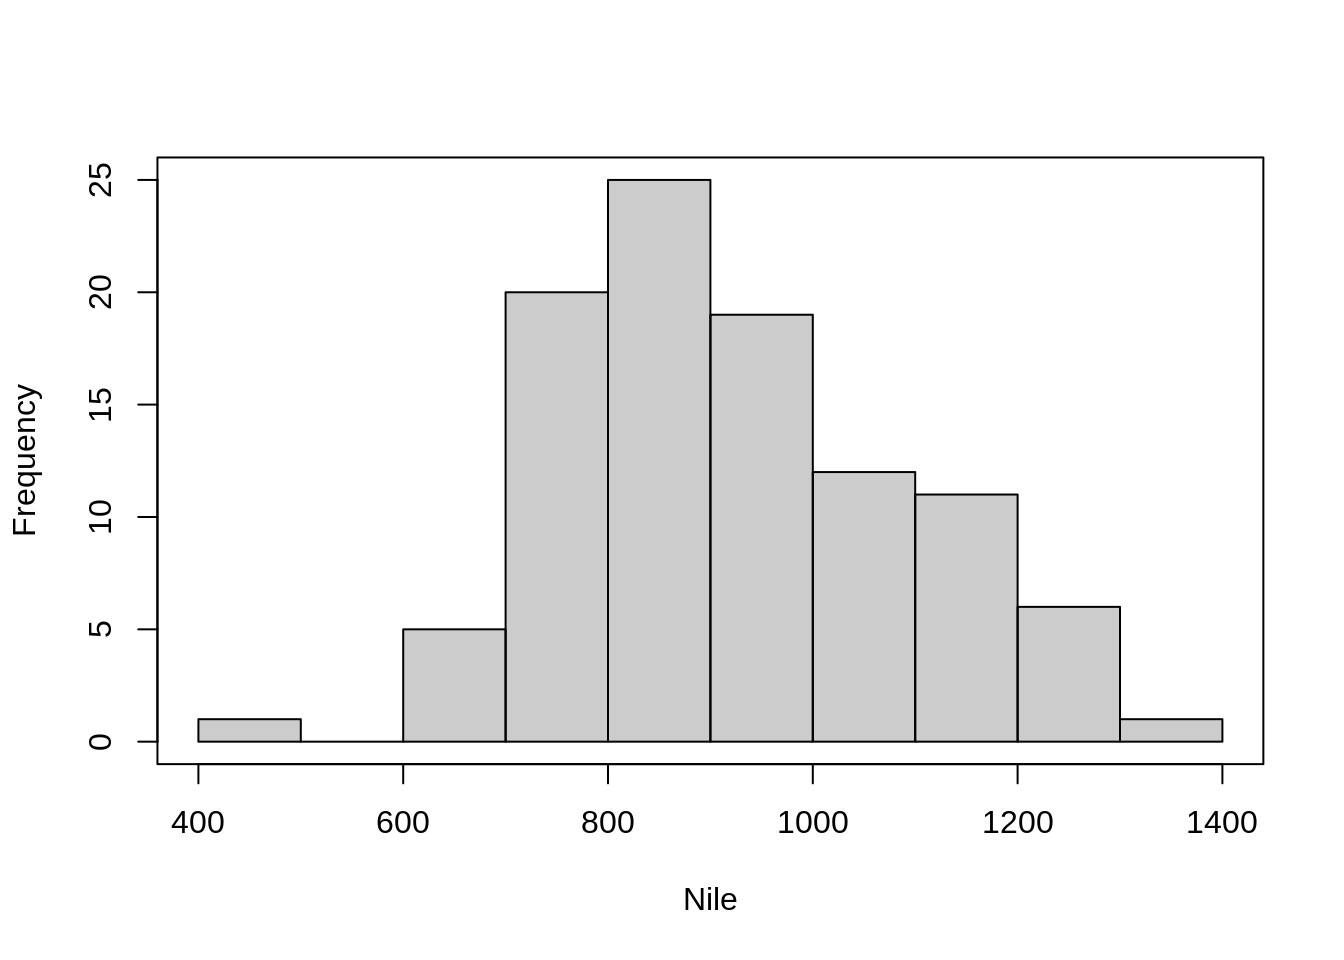
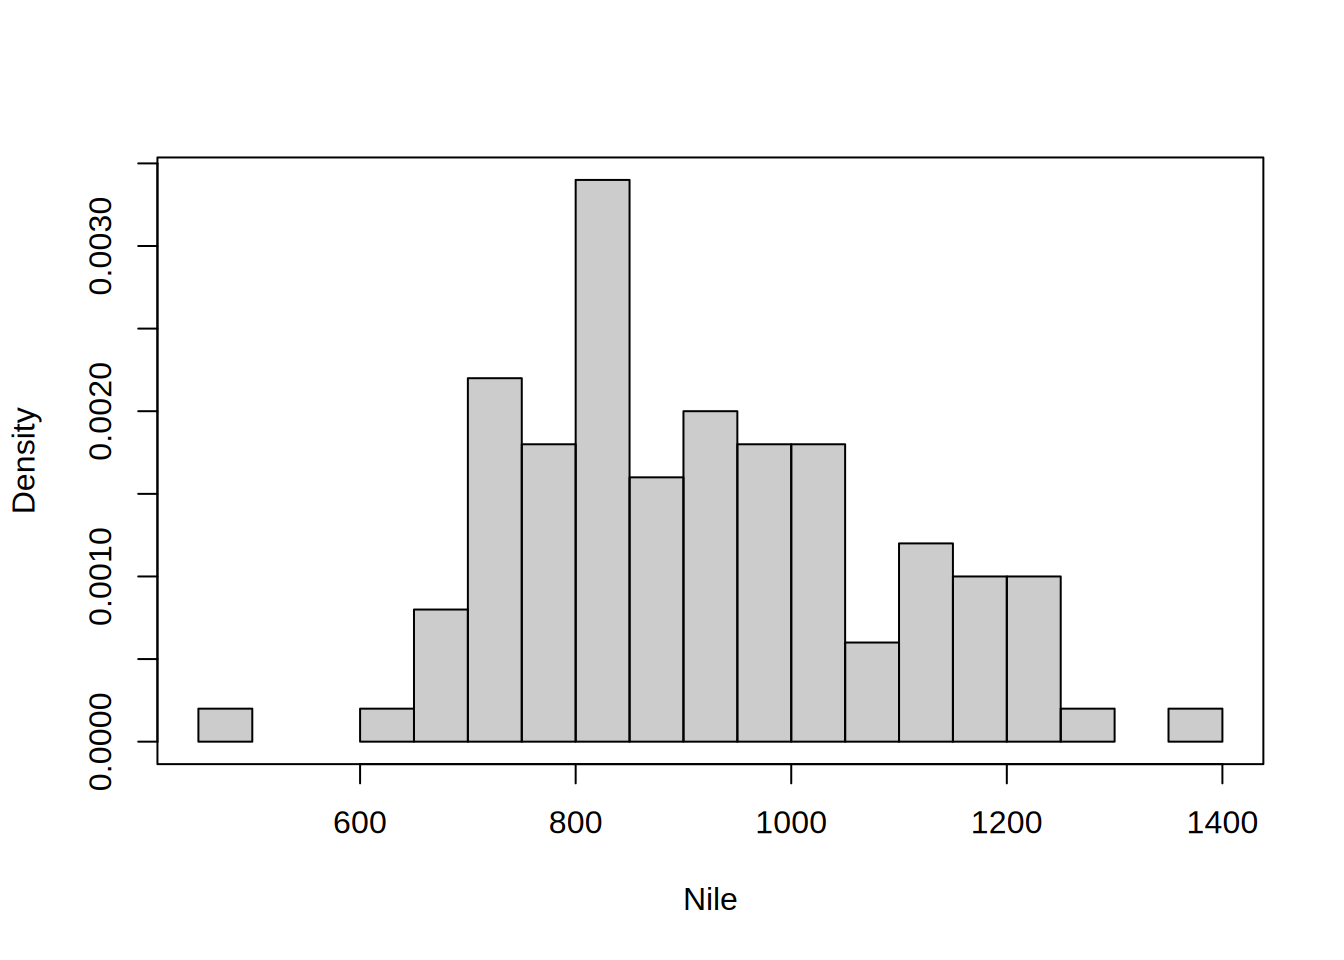
freq
|
logical; if TRUE, the histogram graphic is a representation of frequencies, the counts component of the result; if FALSE, probability densities, component density, are plotted (so that the histogram has a total area of one). Defaults to TRUE if and only if breaks are equidistant (and probability is not specified).
|
right
|
logical; if TRUE, the histogram cells are right-closed (left open) intervals.
|
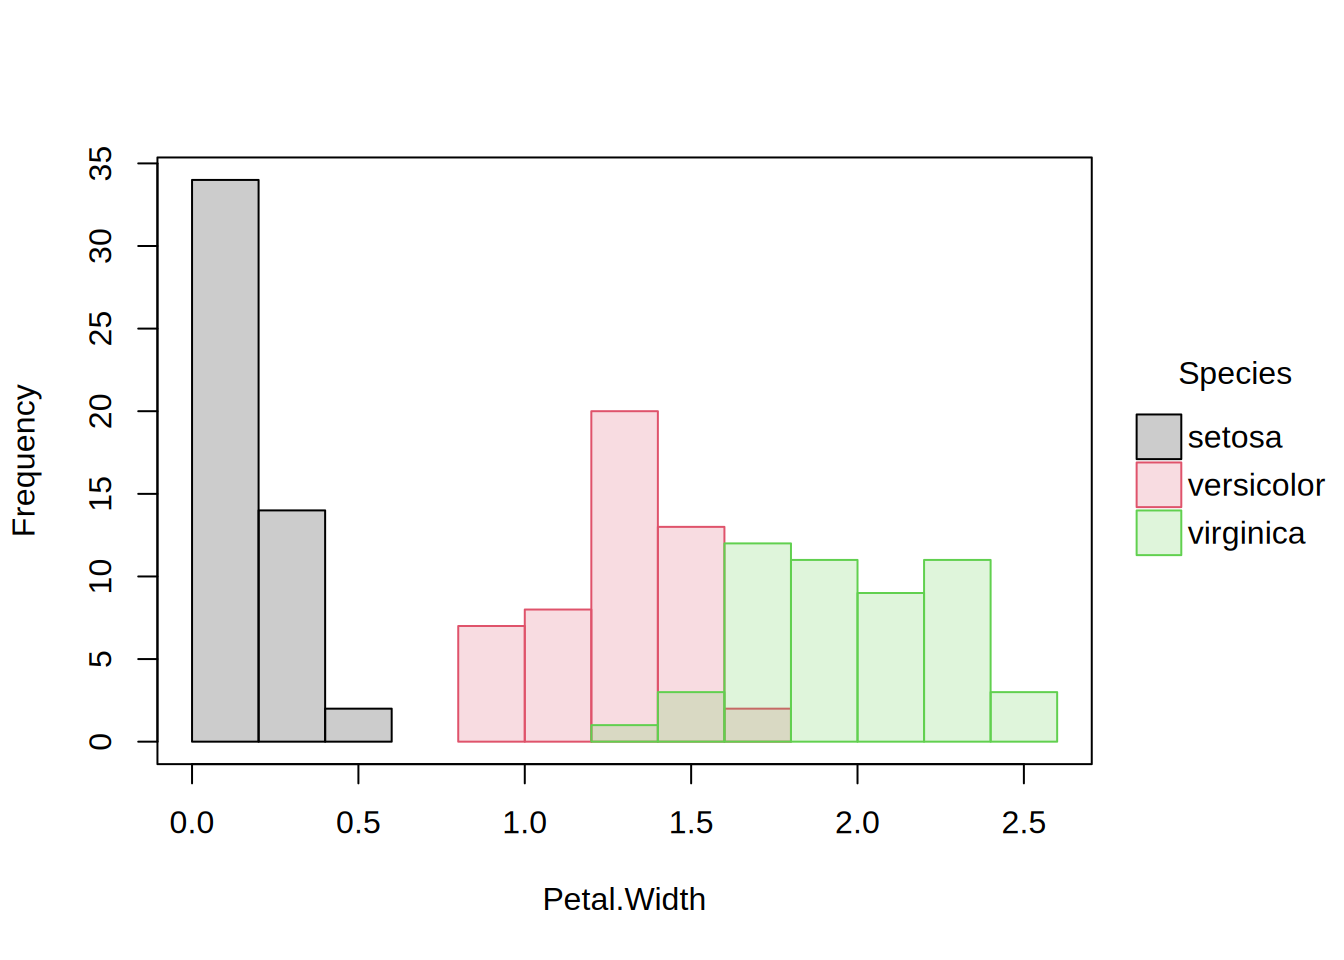
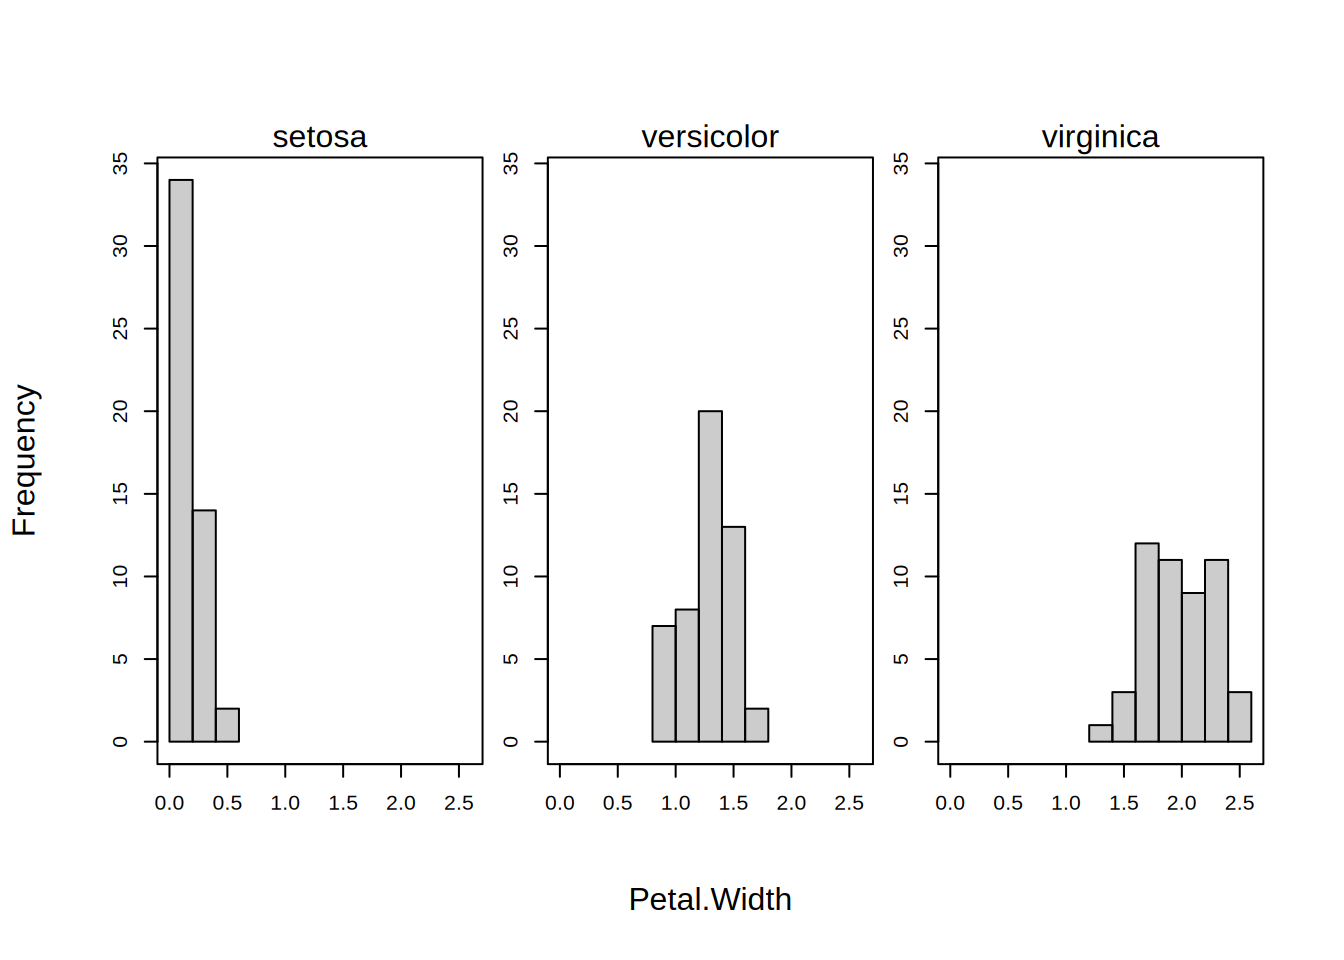
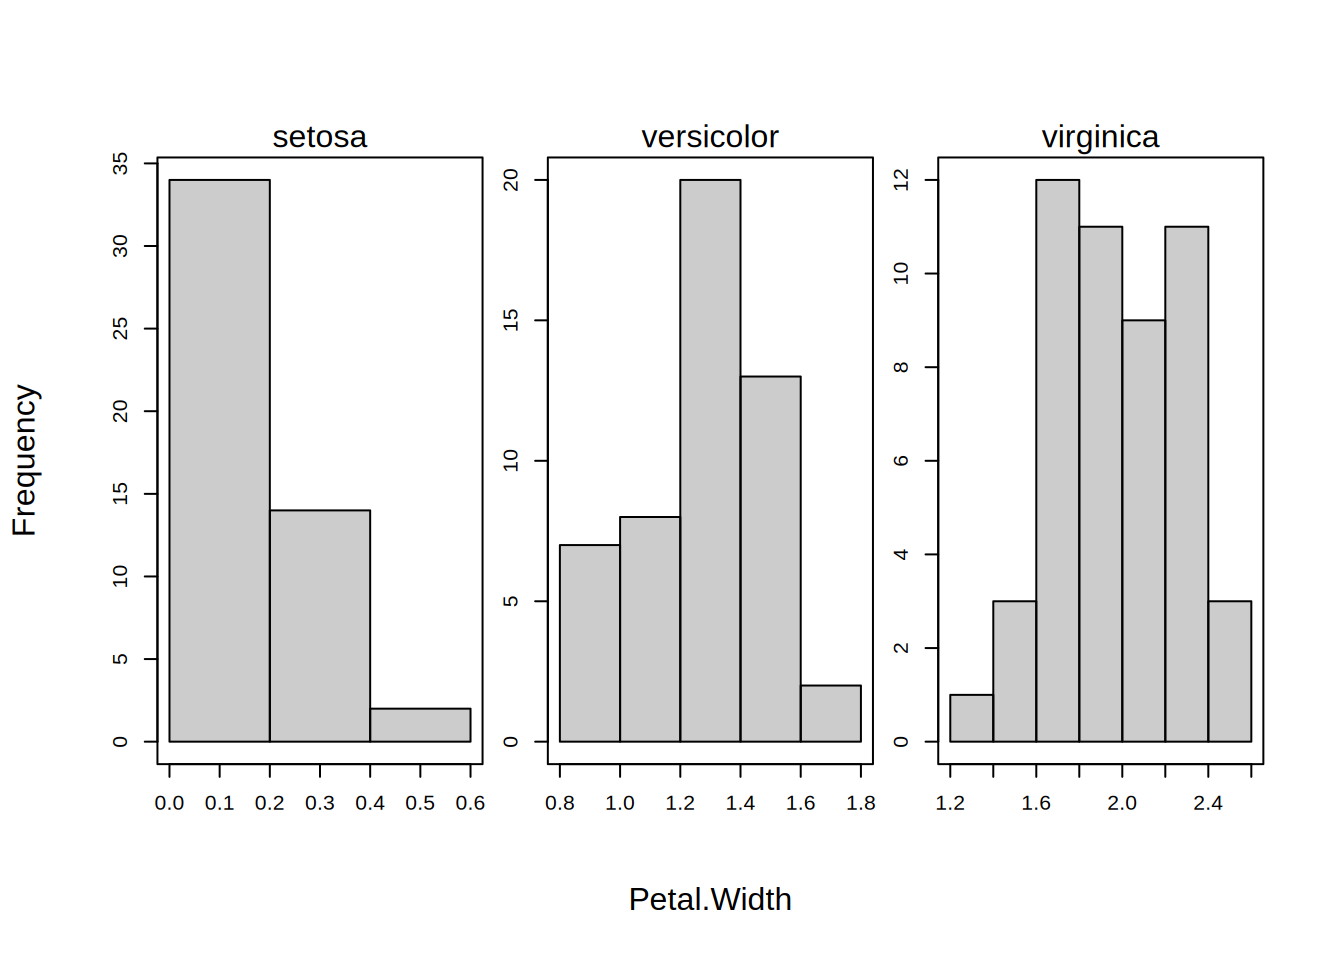
free.breaks
|
Logical indicating whether the breakpoints should be computed separately for each group or facet? Default is FALSE, meaning that the breakpoints are computed from the full dataset; thus ensuring common bin widths across each group/facet. Can also use free as an acceptable argument alias. Ignored if there are no groups and/or facets.
|
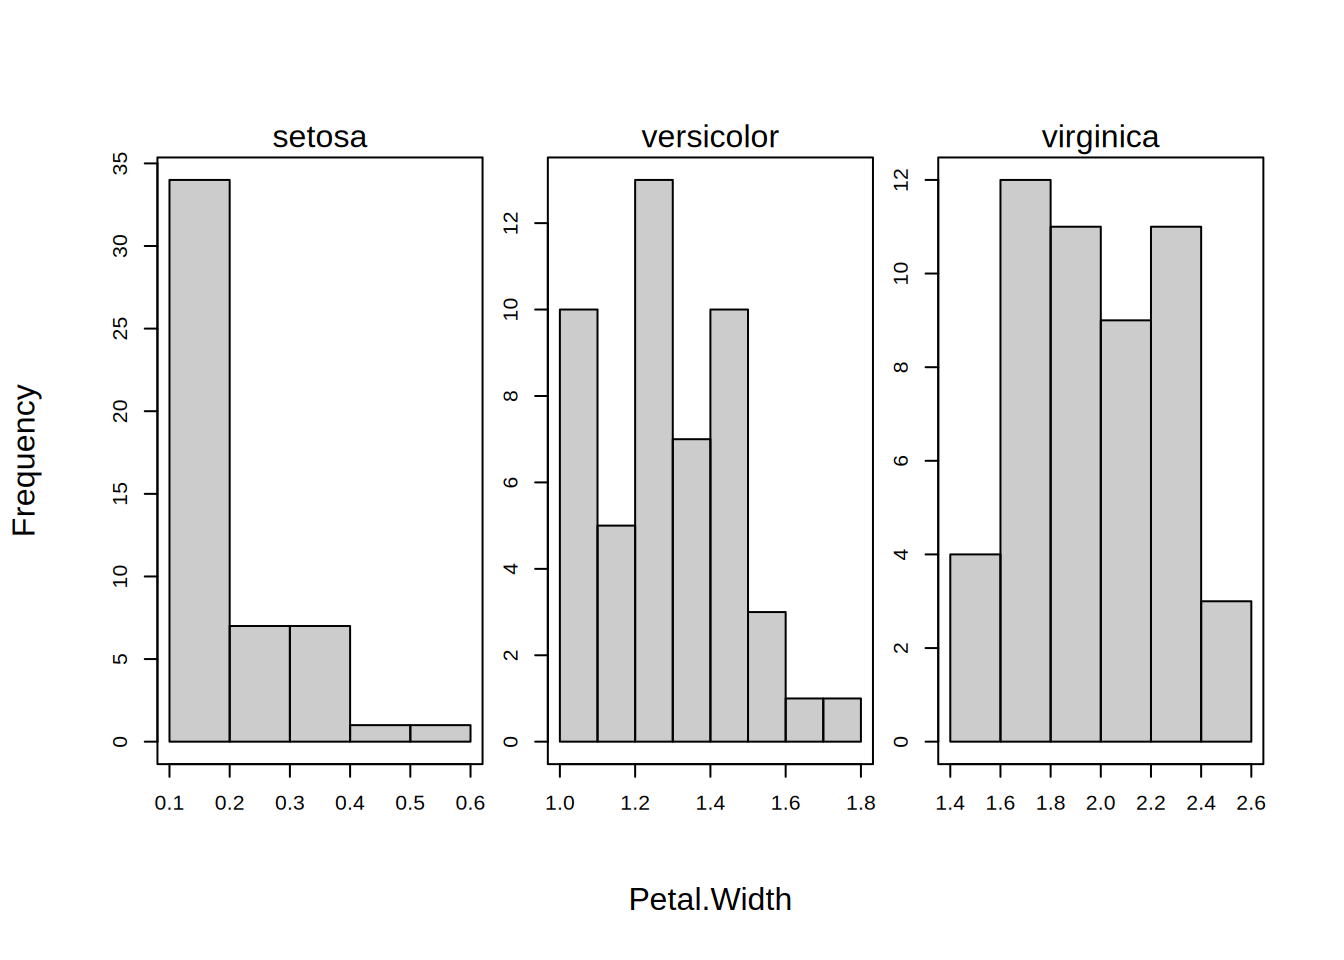
drop.zeros
|
Logical indicating whether bins with zero counts should be dropped before plotting. Default is TRUE. Note that switching to FALSE may interfere with faceted plot behaviour if facet.args = list(free), since the x variable is effectively recorded over the full range of the x-axis (even if it does not extend over this range for every group).
|