labels
|
Character vector of length 1 or the same length as the number of x,y coordinates. If left as NULL, then the labels will automatically inherit the corresponding y values. Can also be supplied as a top-level tinyplot argument, which additionally supports non-standard evaluation against data and takes precedence if both are given. See Examples.
|
labeller
|
A formatting function (or convenience string) passed to tinylabel for formatting the labels. Useful for ensuring that the text labels match the formatting of an axis, e.g. labeller = “%” to display the labels as percentages. Default is NULL, i.e. no formatting. See Examples.
|
adj
|
one or two values in \([0, 1]\) which specify the x (and optionally y) adjustment (‘justification’) of the labels, with 0 for left/bottom, 1 for right/top, and 0.5 for centered. On most devices values outside \([0, 1]\) will also work. See below.
|
pos
|
a position specifier for the text. If specified this overrides any adj value given. Values of 1, 2, 3 and 4, respectively indicate positions below, to the left of, above and to the right of the specified (x,y) coordinates.
|
offset
|
when pos is specified, this value controls the distance (‘offset’) of the text label from the specified coordinate in fractions of a character width.
|
family
|
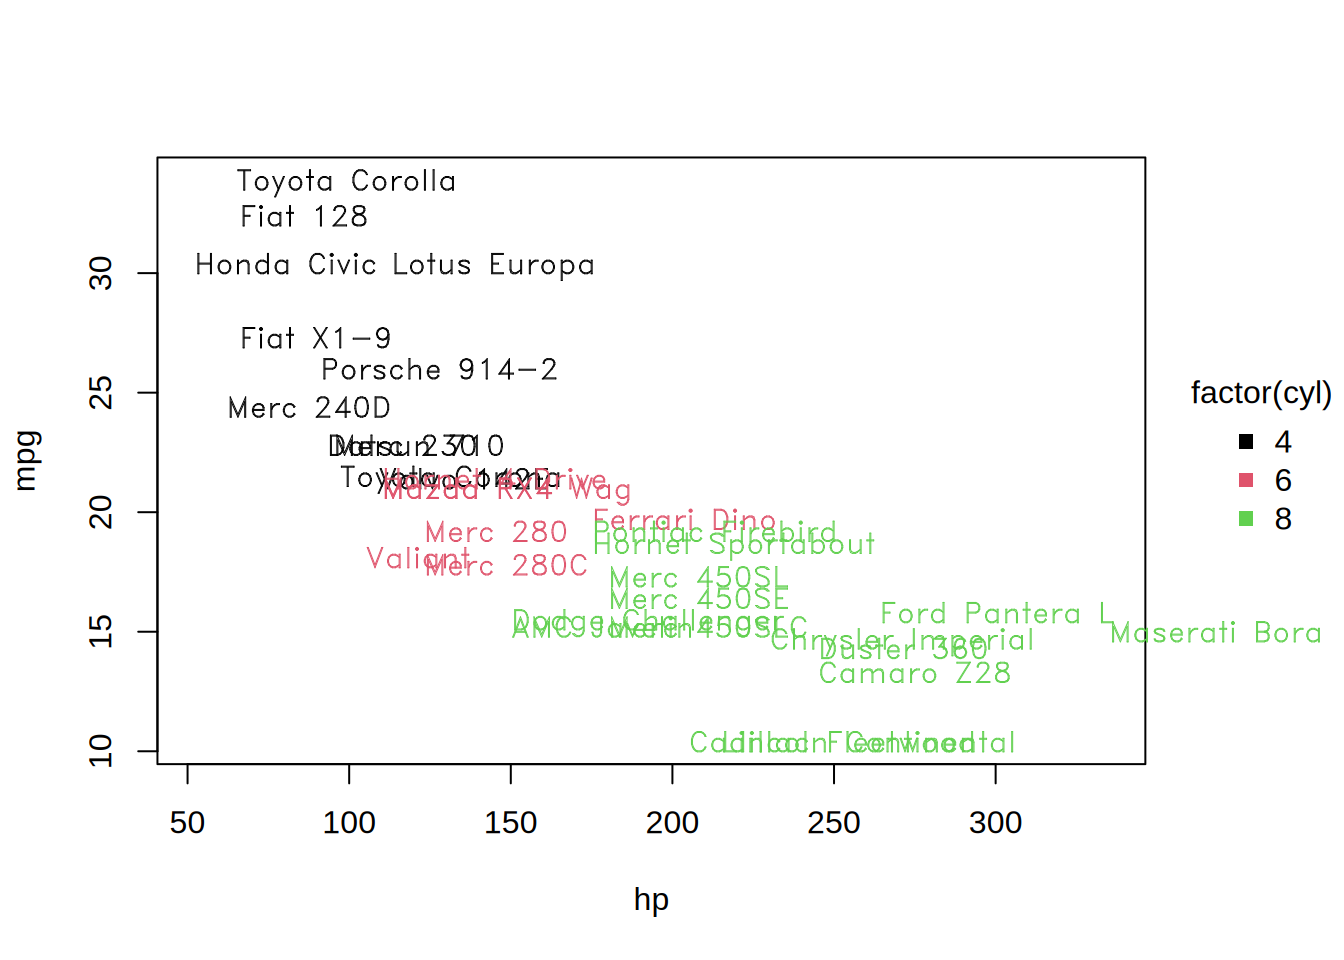
The name of a font family. Default of NULL means that the family will be the same as the main plot text, following par. Note that if a family argument is provided, then vfont (below) will automatically be ignored.
|
font
|
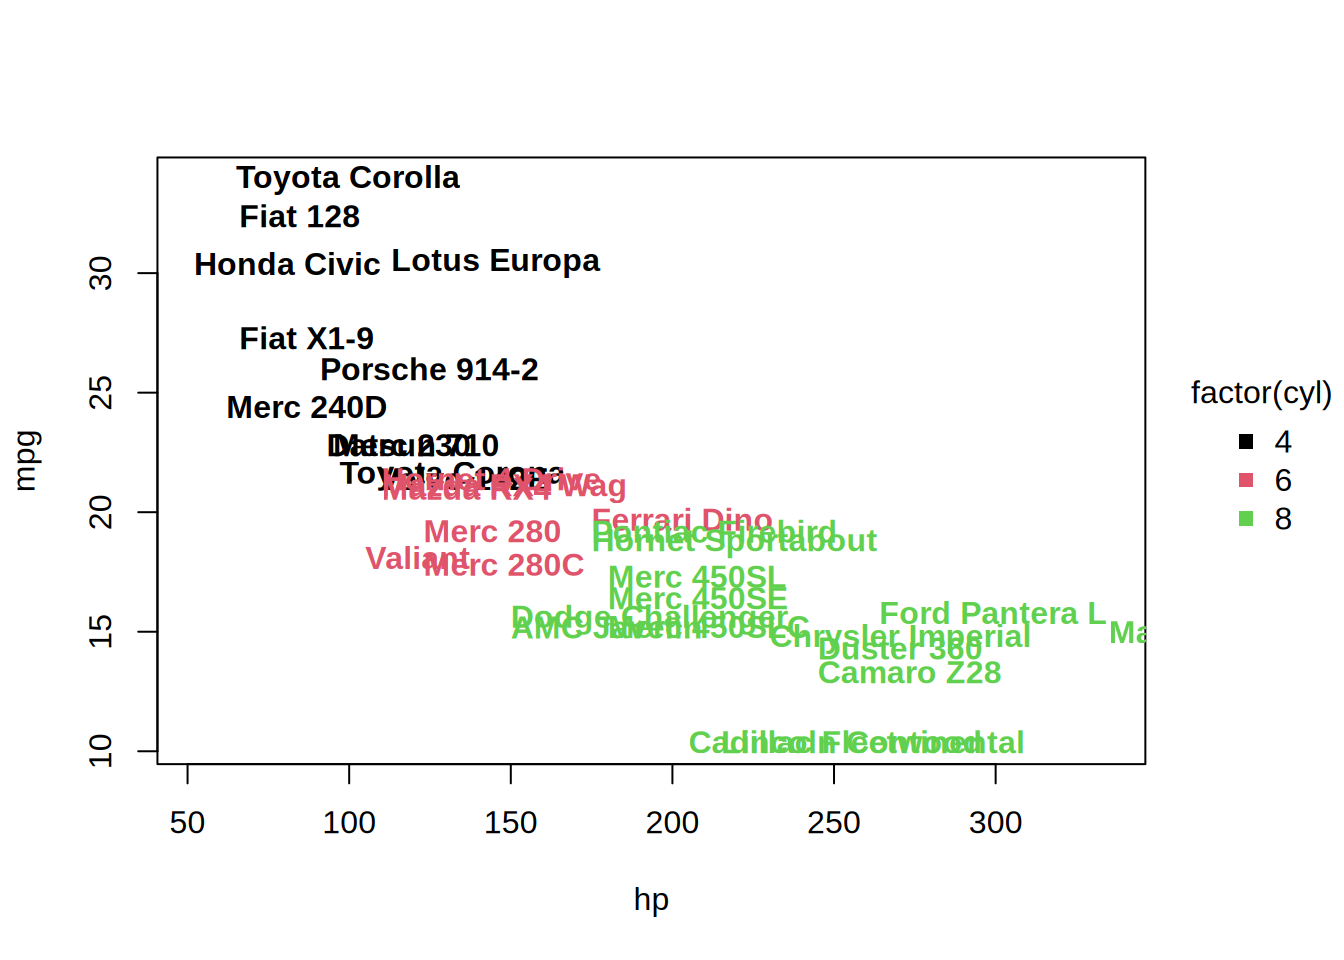
Integer giving the font face to be used, following par. On most devices, the mapping is: 1 = regular, 2 = bold, 3 = italic, 4 = bold italic, and 5 = symbol.
|
vfont
|
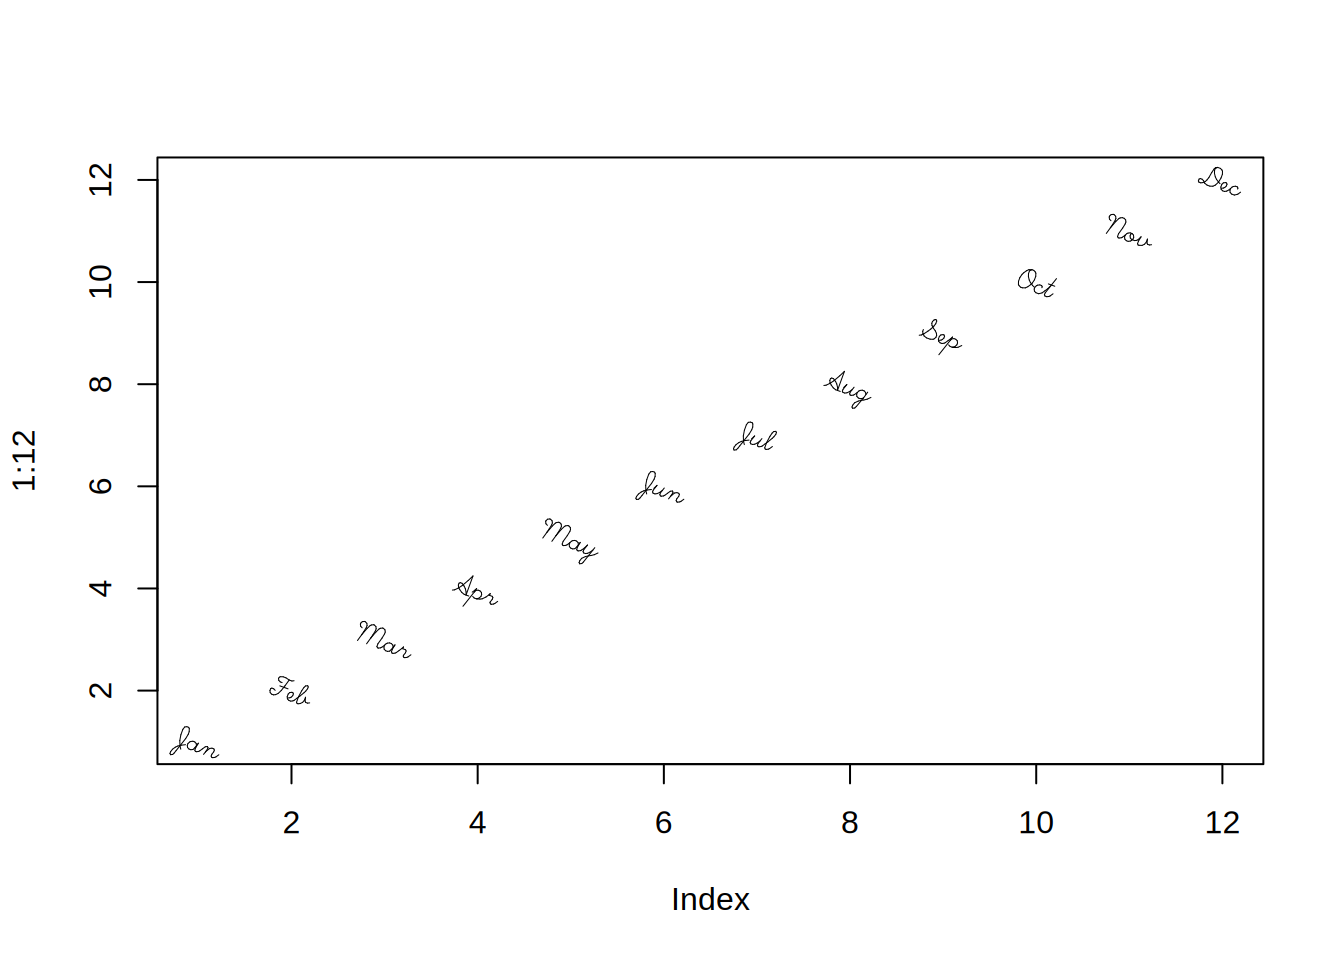
NULL for the current font family, or a character vector of length 2 for Hershey vector fonts. The first element of the vector selects a typeface and the second element selects a style. Ignored if labels is an expression.
|
xpd
|
Logical value or NA denoting text clipping behaviour, following par.
|
srt
|
Numeric giving the desired string rotation in degrees.
|
repel
|
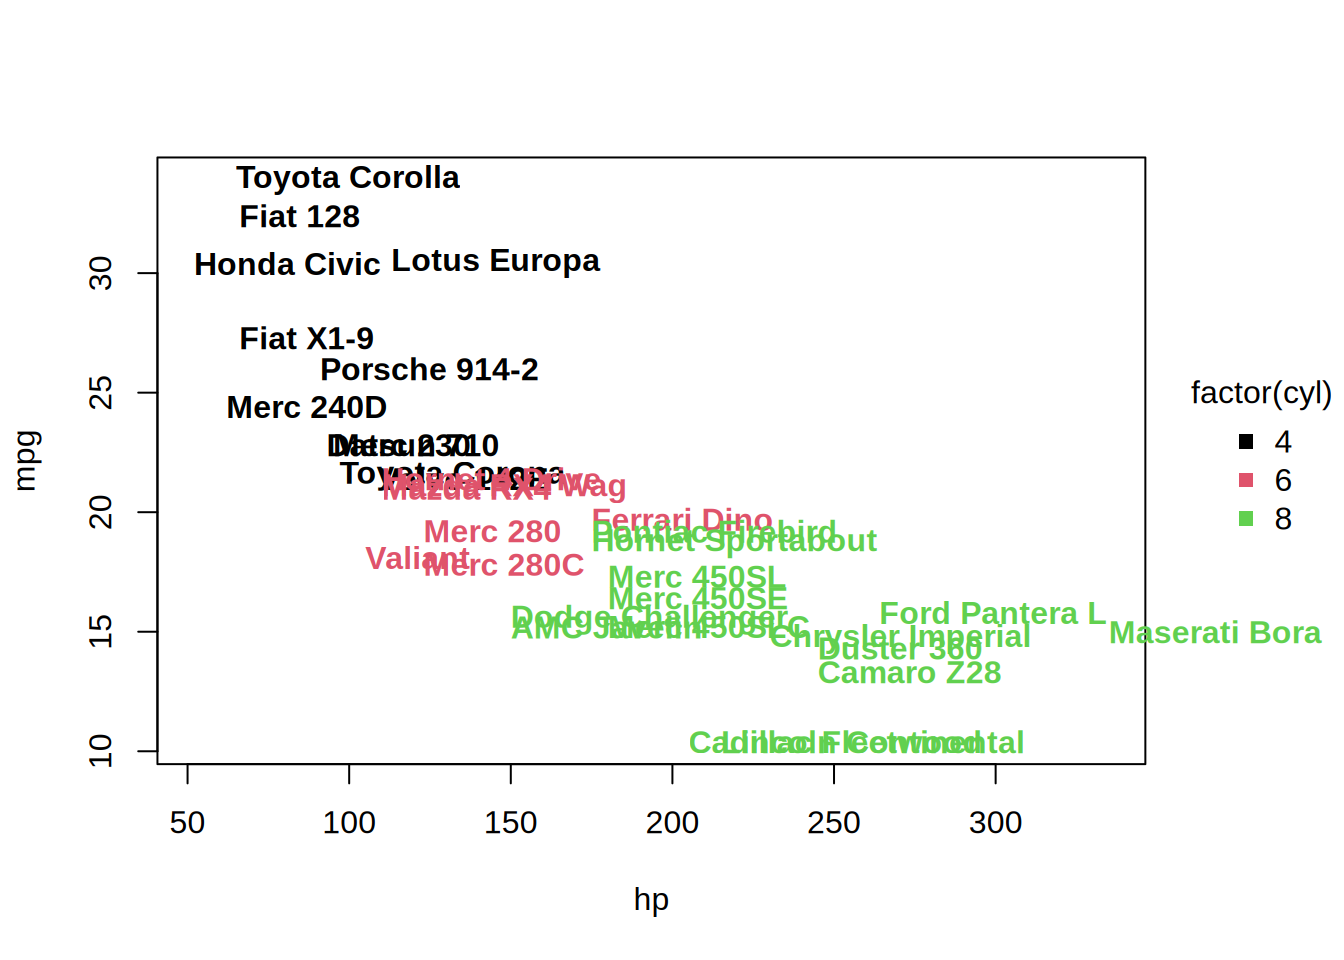
Logical or numeric controlling automatic repulsion of overlapping text labels. The default FALSE draws the labels at their exact (x,y) coordinates. TRUE nudges overlapping labels apart using a force-directed algorithm (labels are pushed off each other and then sprung back toward their original positions). A numeric value does the same but additionally enforces that much minimum padding (in user coordinates) between labels. Works best with the default centered text placement (i.e. without pos). Caveat: The repulsion logic currently operates within each group rather than across groups. So the text of different groups may still overlap. See Examples.
|
clim
|
Numeric giving the lower and upper limits of the character expansion (cex) normalization for bubble charts.
|