Plot summary values of y at unique values of x

Description

Applies a summary function to y along unique values of x. For example, plot the mean y value for each x value. Internally, type_summary() applies a thin wrapper around aggregate and then passes the result to type_lines for drawing.

Usage

type_summary(fun = mean, dodge = 0, fixed.dodge = FALSE, ...)

Arguments

fun summarizing function. Should be compatible with aggregate. Defaults to mean.
dodge

Adjustment parameter for dodging overlapping points or ranges in grouped plots along the x-axis (or y-axis for flipped plots). Either:

  • numeric value in the range [0,1). Note that values are scaled relative to the spacing of x-axis breaks, e.g. dodge = 0.1 places the outermost groups one-tenth of the way to adjacent breaks, dodge = 0.5 places them midway between breaks, etc. Values < 0.5 are recommended.

  • logical. If TRUE, the dodge width is calculated automatically based on the number of groups (0.1 per group for 2-4 groups, 0.45 for 5+ groups). If FALSE or 0, no dodging is performed.

Default value is 0 (no dodging). While we do not check, it is strongly recommended that dodging only be used in cases where the x-axis comprises a limited number of discrete breaks.
fixed.dodge Logical. If FALSE (default), dodge positions are calculated independently for each x value, based only on the groups present at that position. If TRUE, dodge positions are based on all groups, ensuring "fixed" spacing across x-axis breaks (i.e., even if some groups are missing for a particular x value).
Additional arguments are passed to the lines() function, e.g. type=“p” or col=“pink”.

See Also

aggregate which performs the summarizing (aggregating) behind the scenes.

Examples

library("tinyplot")

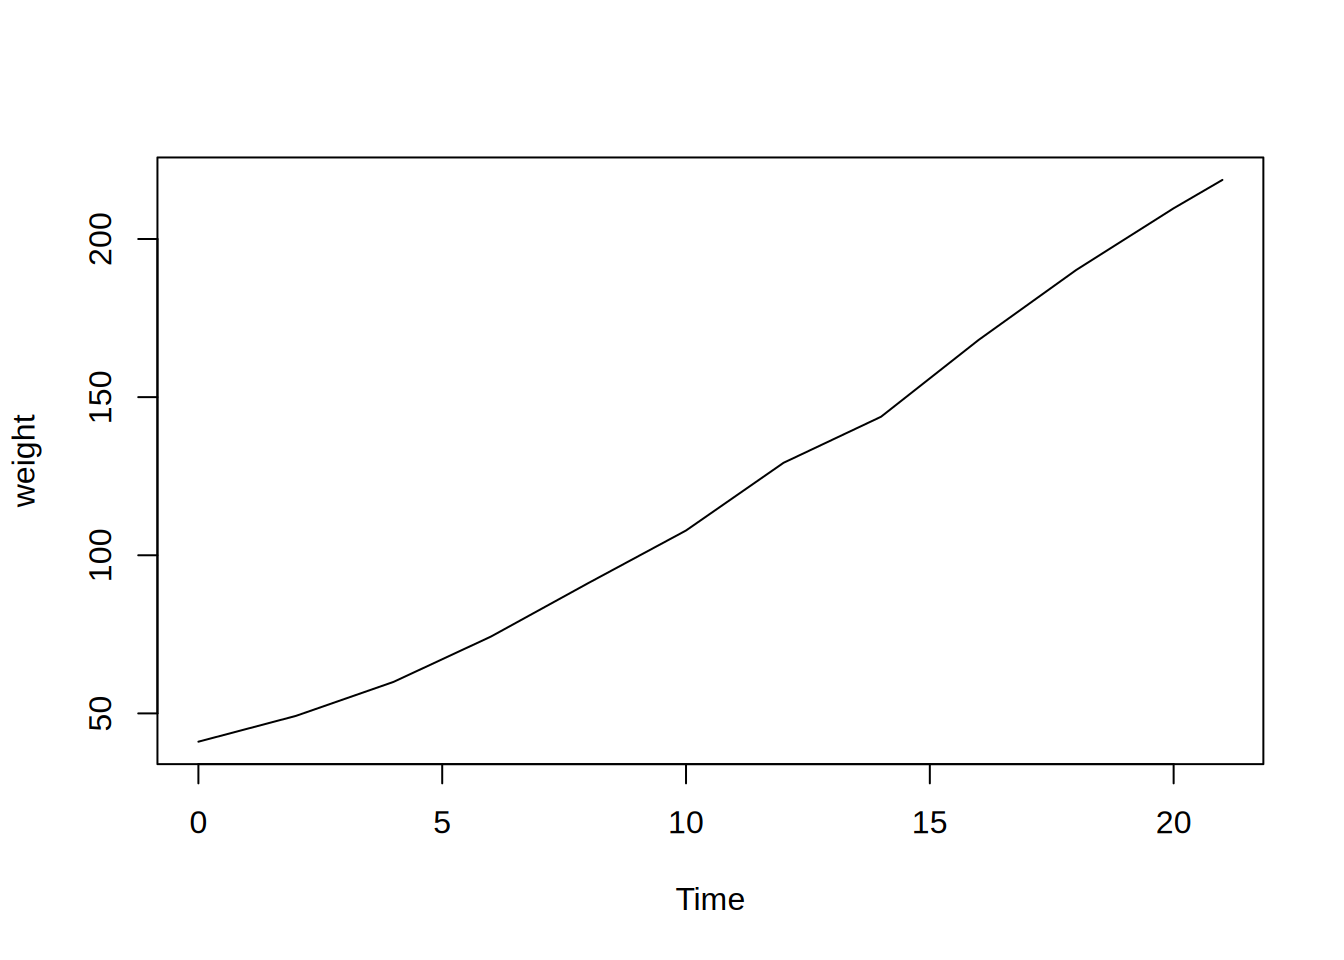
# Plot the mean chick weight over time
tinyplot(weight ~ Time, data = ChickWeight, type = "summary")
# Note: "mean" is the default function, so these are also equivalent:
# tinyplot(weight ~ Time, data = ChickWeight, type = type_summary())
# tinyplot(weight ~ Time, data = ChickWeight, type = type_summary(mean))

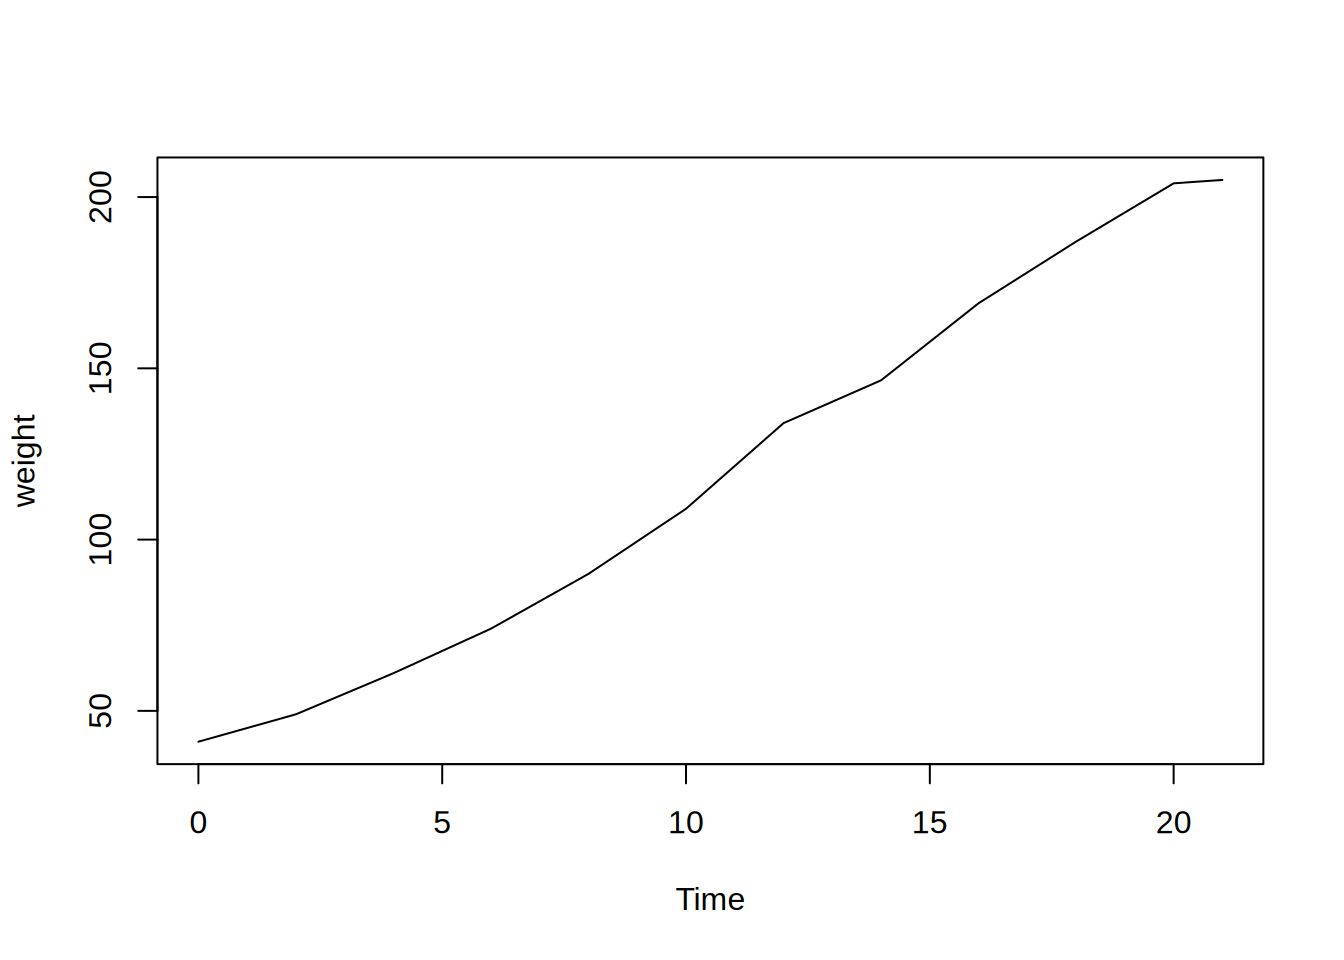
# Plot the median instead
tinyplot(weight ~ Time, data = ChickWeight, type = type_summary(median))
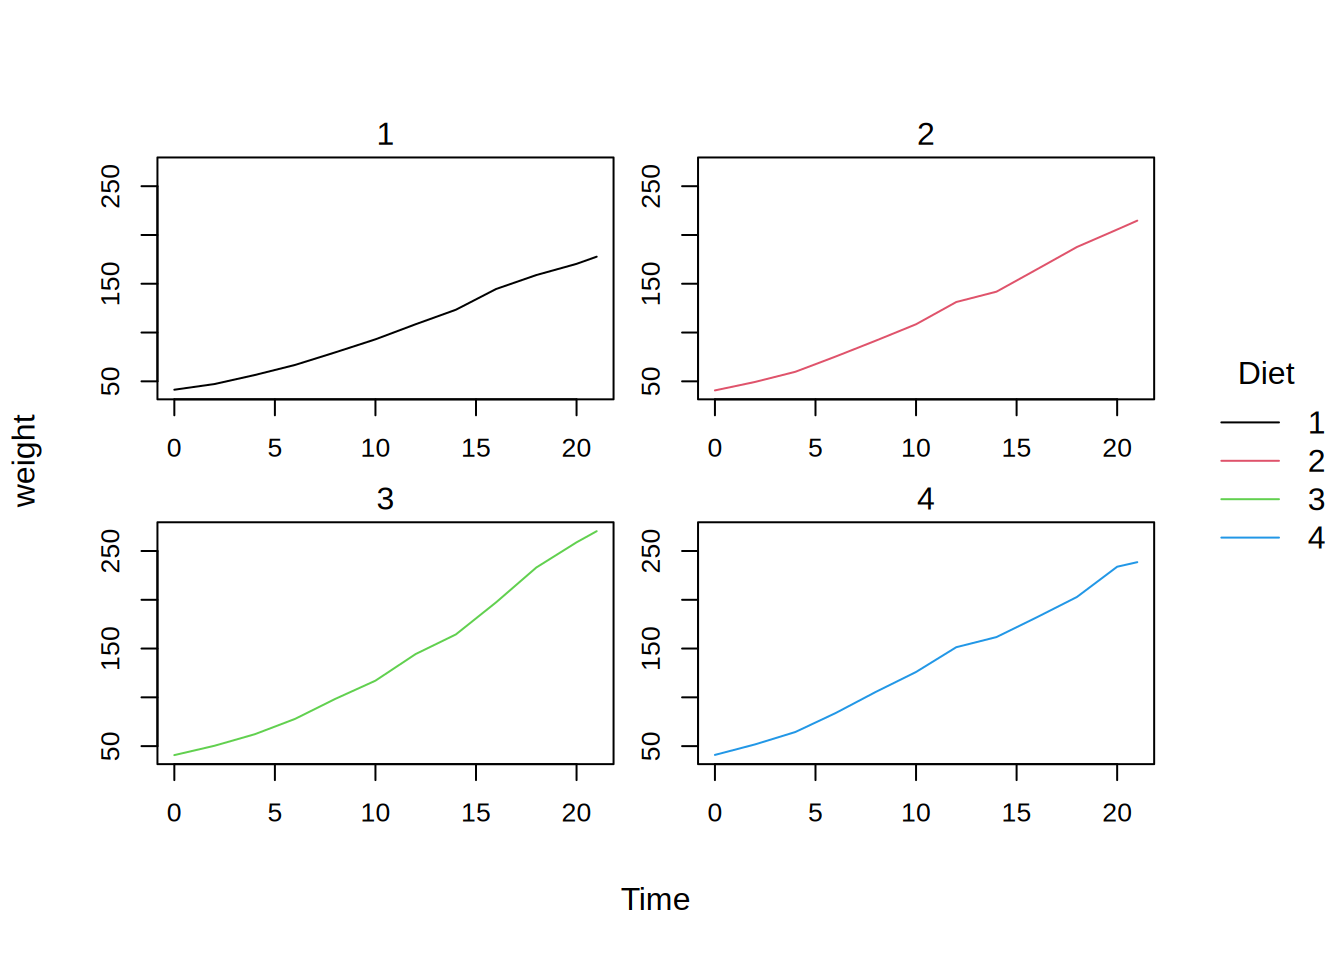
# Works with groups and/or facets too
tinyplot(weight ~ Time | Diet, facet = "by", data = ChickWeight, type = "summary")
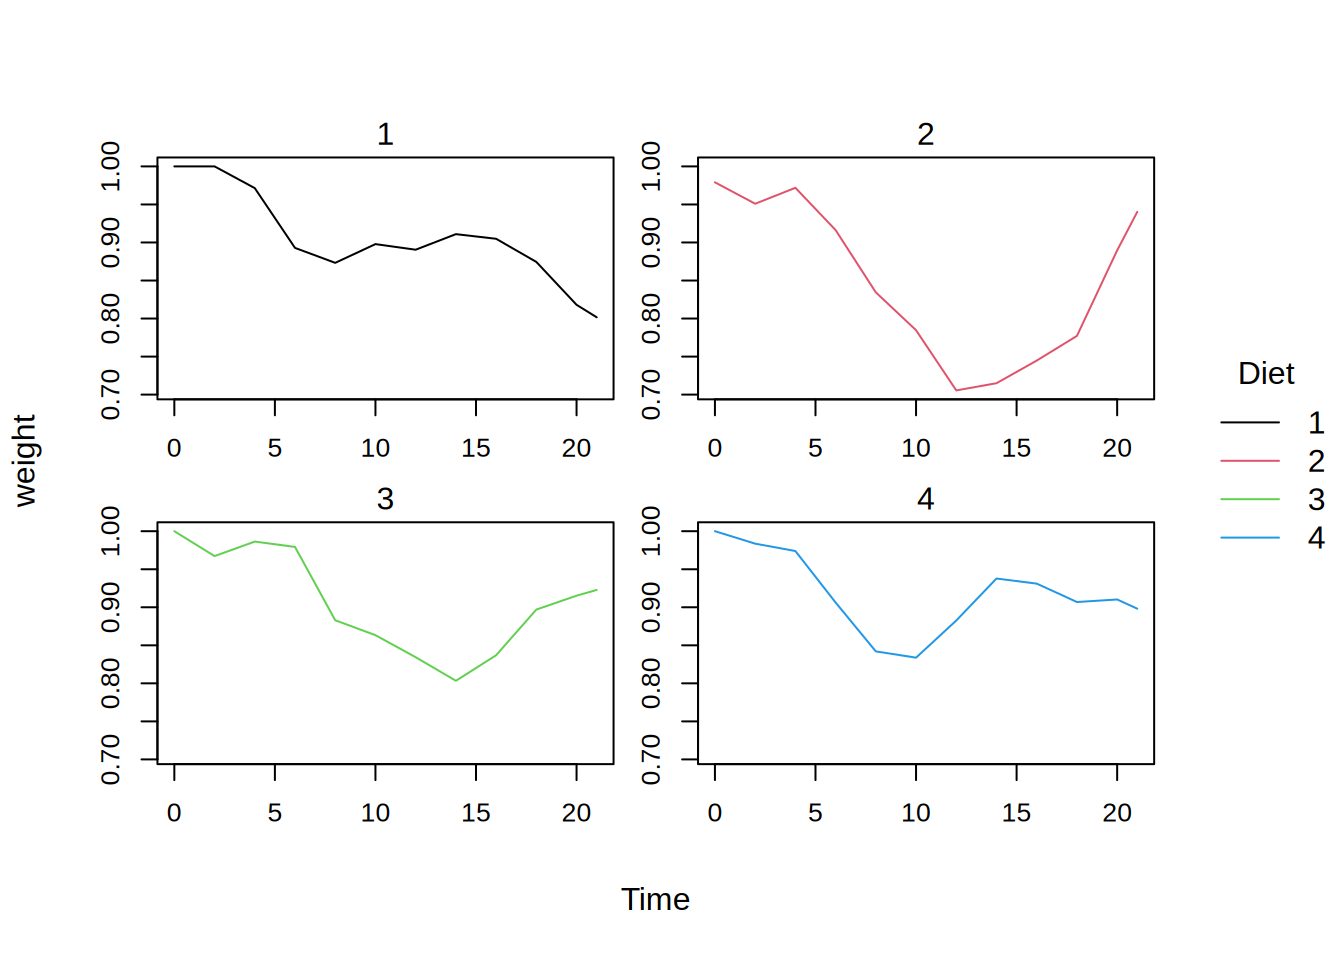
# Custom/complex function example
tinyplot(
  weight ~ Time | Diet,
  facet = "by", data = ChickWeight,
  type = type_summary(function(y) quantile(y, probs = 0.9) / max(y))
)