library("tinyplot")

x = 1e4
tinylabel(x, "comma")
[1] "10,000"tinylabel(x, ",") # same[1] "10,000"tinylabel(x, "$") # or "dollar"[1] "$10,000"# invoke tinylabel from a parent tinyplot call...
# => x/yaxl for adjusting axes tick labels
# => legend = list(labeller = ...) for adjusting the legend labels
s77 = transform(data.frame(state.x77), Illiteracy = Illiteracy / 100)
tinyplot(Life.Exp ~ Income | Illiteracy, data = s77,
xaxl = '$',
legend = list(labeller = '%'))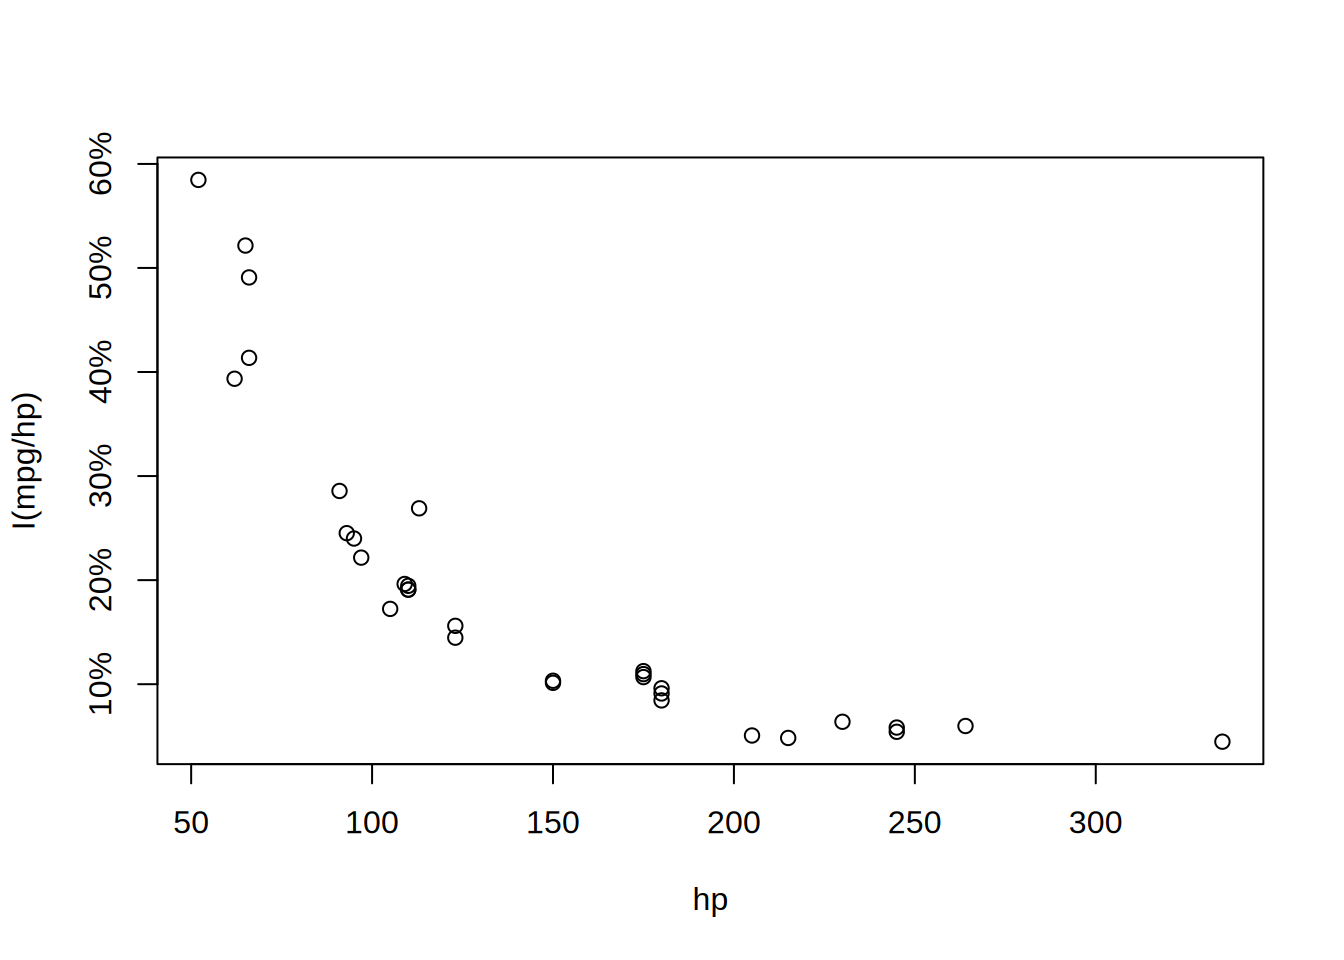
# log example (combined with axis scaling)
tinyplot(x = 10^c(10:0), y = 0:10, type = "b",
         log = "x", xaxl = "log")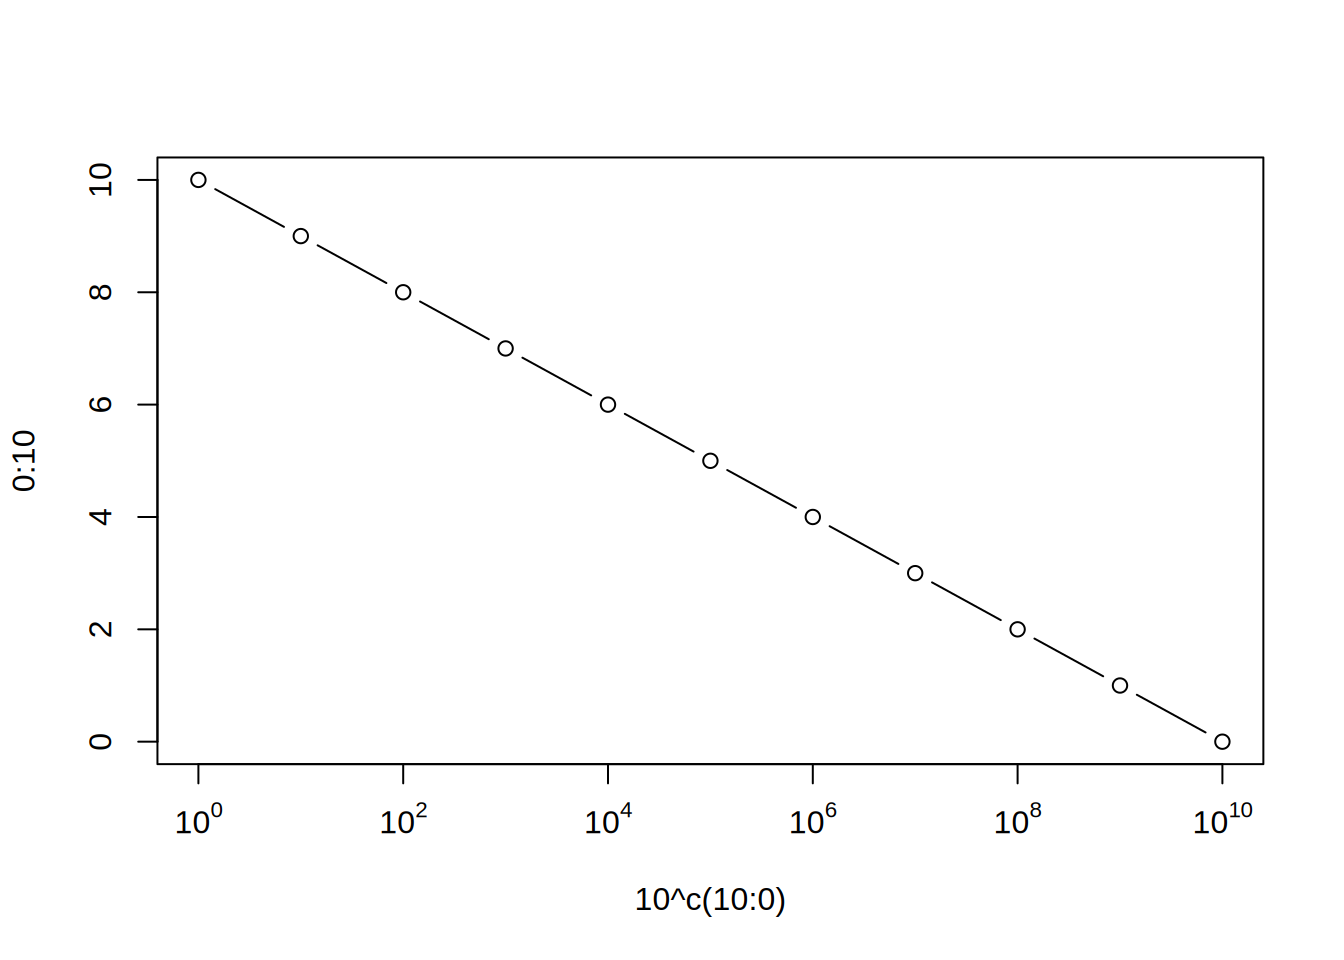
# combine with `x/yaxb` to adjust the actual tick marks ("break points")
# at the same time
tinyplot(x = 10^c(10:0), y = 0:10, type = "b",
         log = "x", xaxl = "log", xaxb = 10^c(1,3,5,7,9))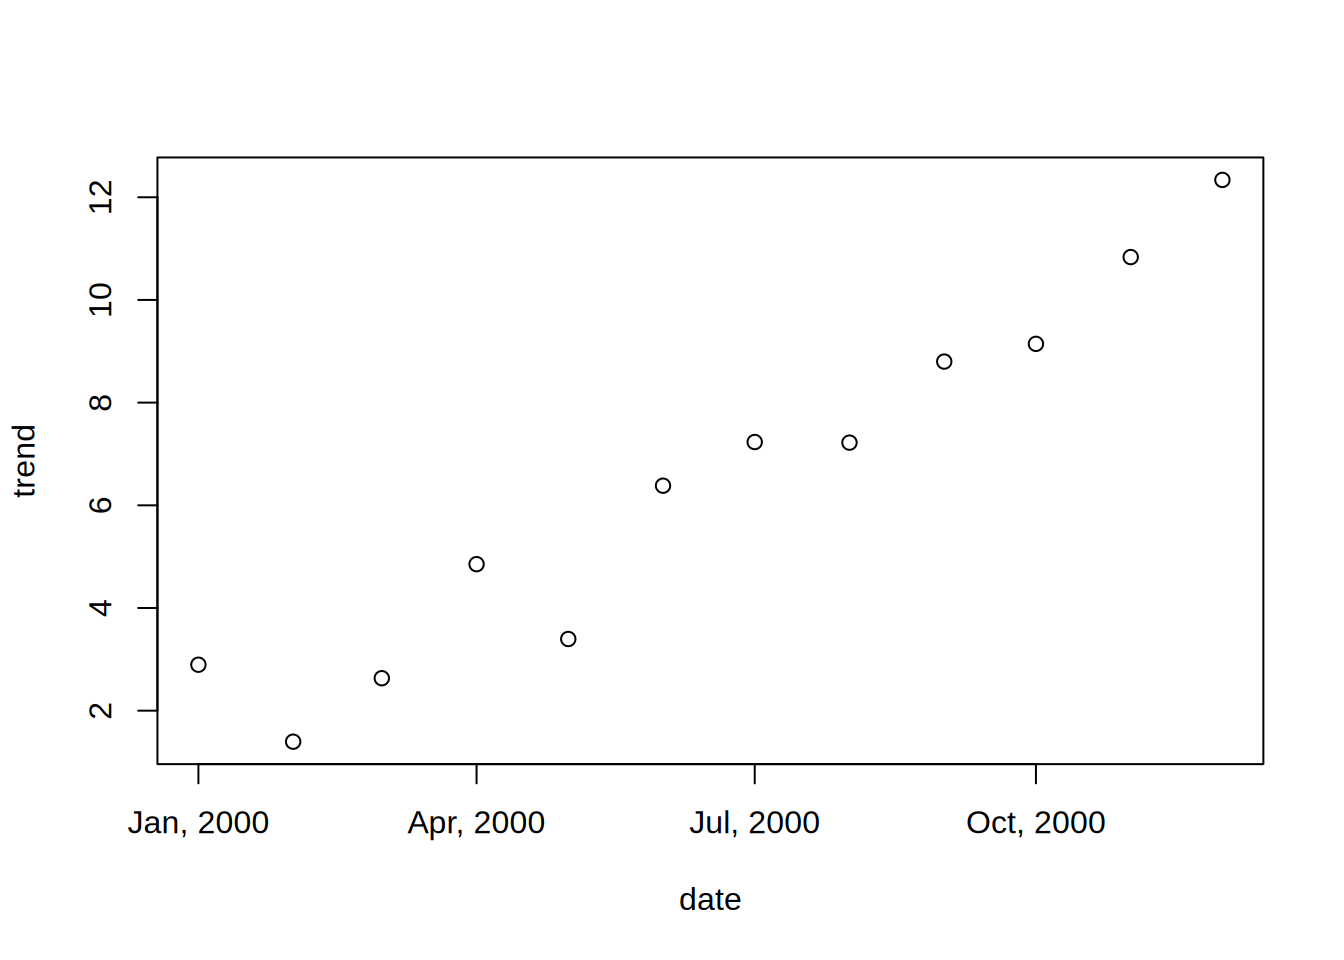
#
## custom function examples

## example I: date formatting

dat = data.frame(
  date = seq(as.Date("2000/1/1"), by = "month", length.out = 12),
  trend = 1:12 + rnorm(12, sd = 1)
)

tinyplot(trend ~ date, data = dat,
         xaxl = function(x) format(x, "%b, %Y"))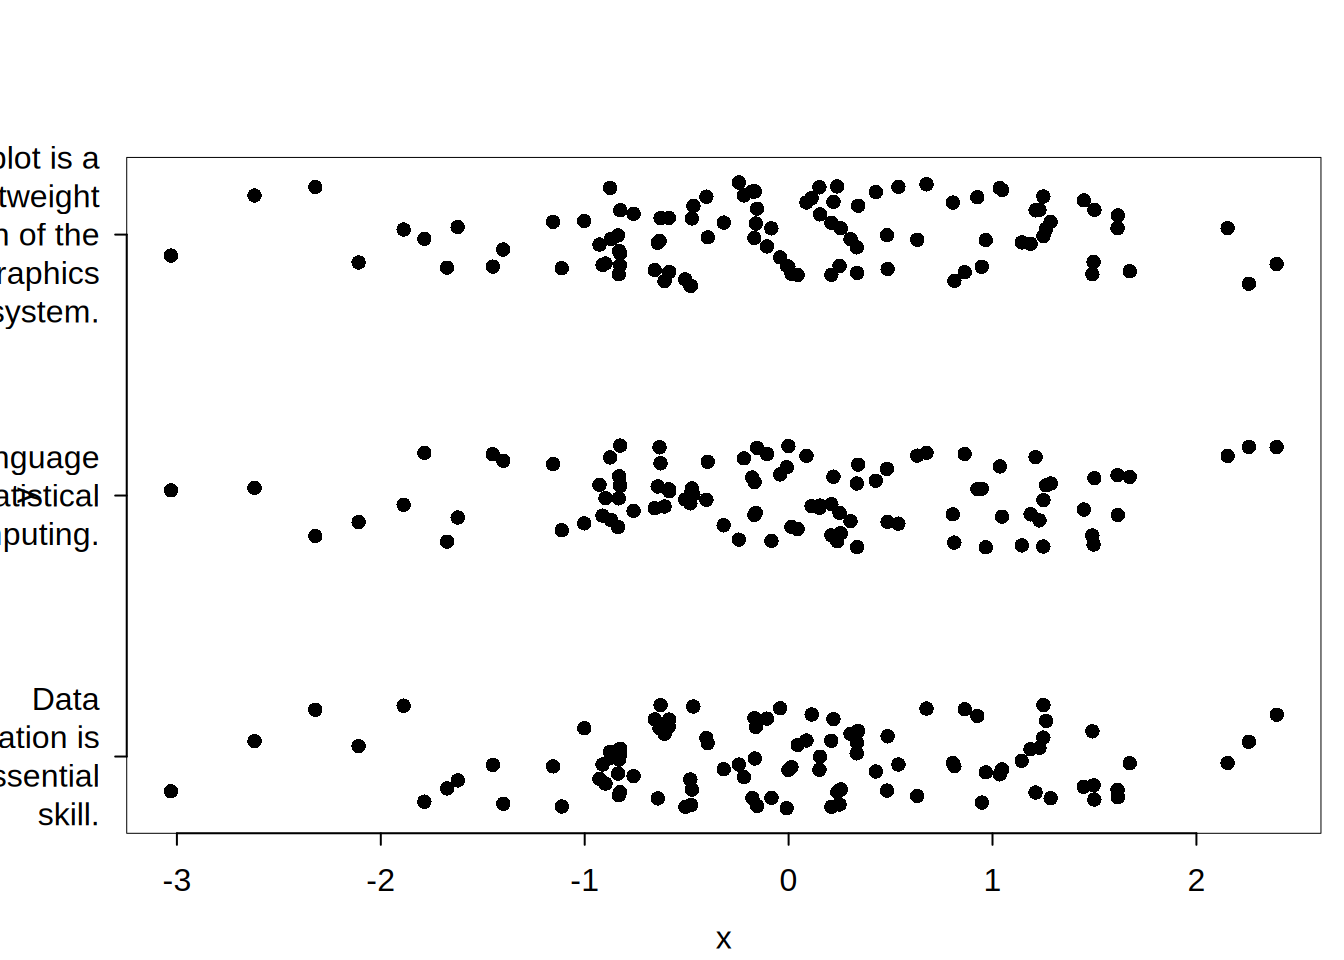
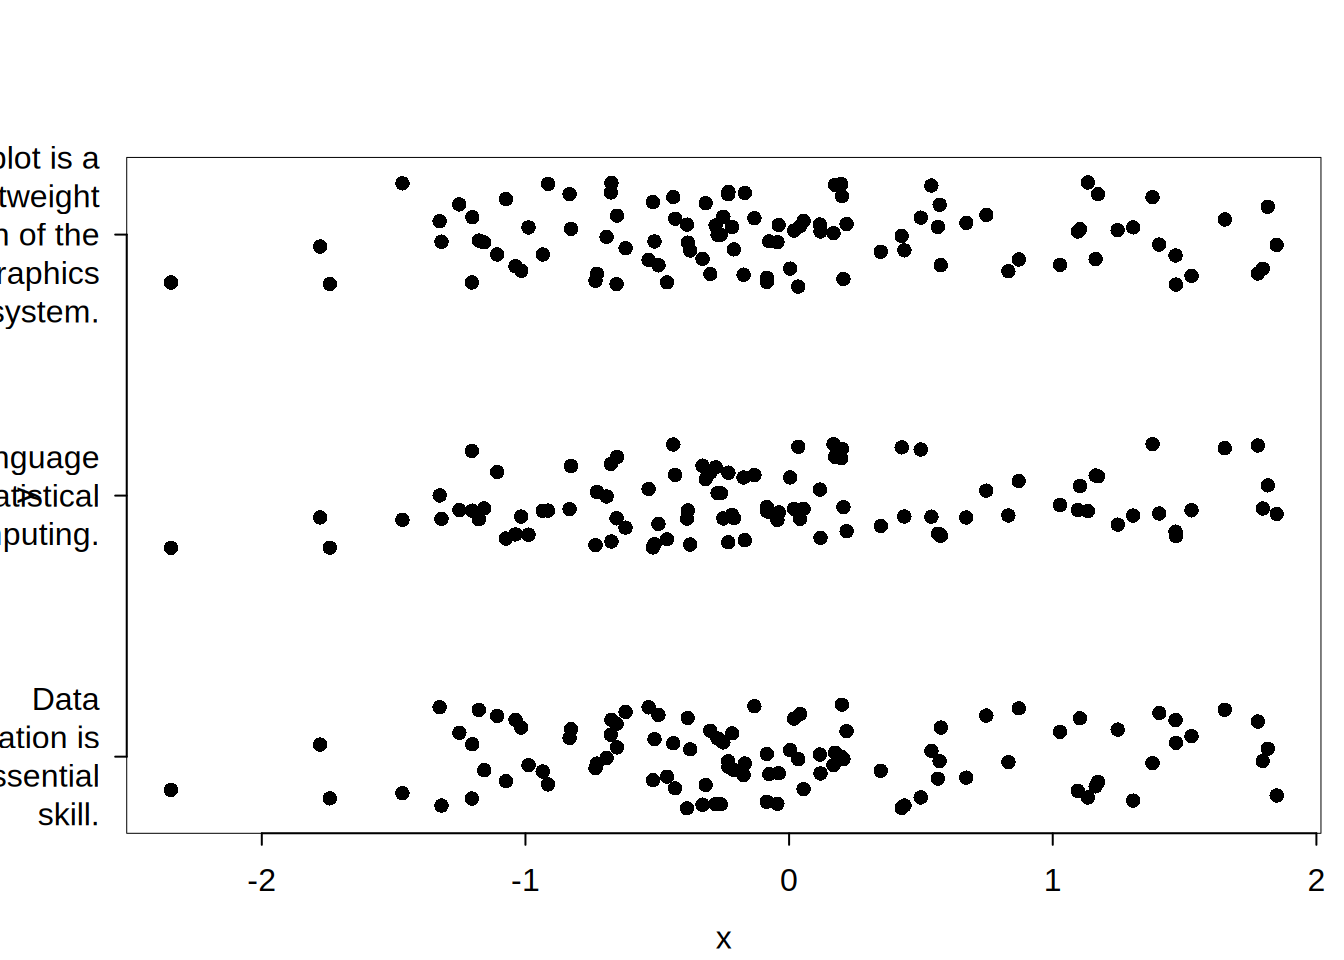
## example II: string wrapping

# create a "vectorised" version of `base::strwrap` that breaks long
# strings into new lines every 18 characters
strwrap18 = function(x) sapply(
  strwrap(x, width = 18, simplify = FALSE),
  paste,
  collapse = "\n"
)

# now demonstrate on a dataset with long y-tick labels
dat2 = data.frame(
  x = rep(rnorm(100), 3),
  y = c(
    "tinyplot is a lightweight extension of the base R graphics system.",
    "R is a language for statistical computing.",
    "Data visualization is an essential skill."
  )
)

tinyplot(y ~ x, data = dat2, type = "j",
         yaxl = strwrap18,
         theme = "bw") # use theme for horizontal labels + dynamic margin