library("tinyplot")

# "lm" type convenience string
tinyplot(Sepal.Width ~ Petal.Width, data = iris, type = "lm")
# Grouped model fits (here: illustrating an example of Simpson's paradox)
tinyplot(Sepal.Width ~ Petal.Width | Species, data = iris, type = "lm")
tinyplot_add(type = "p")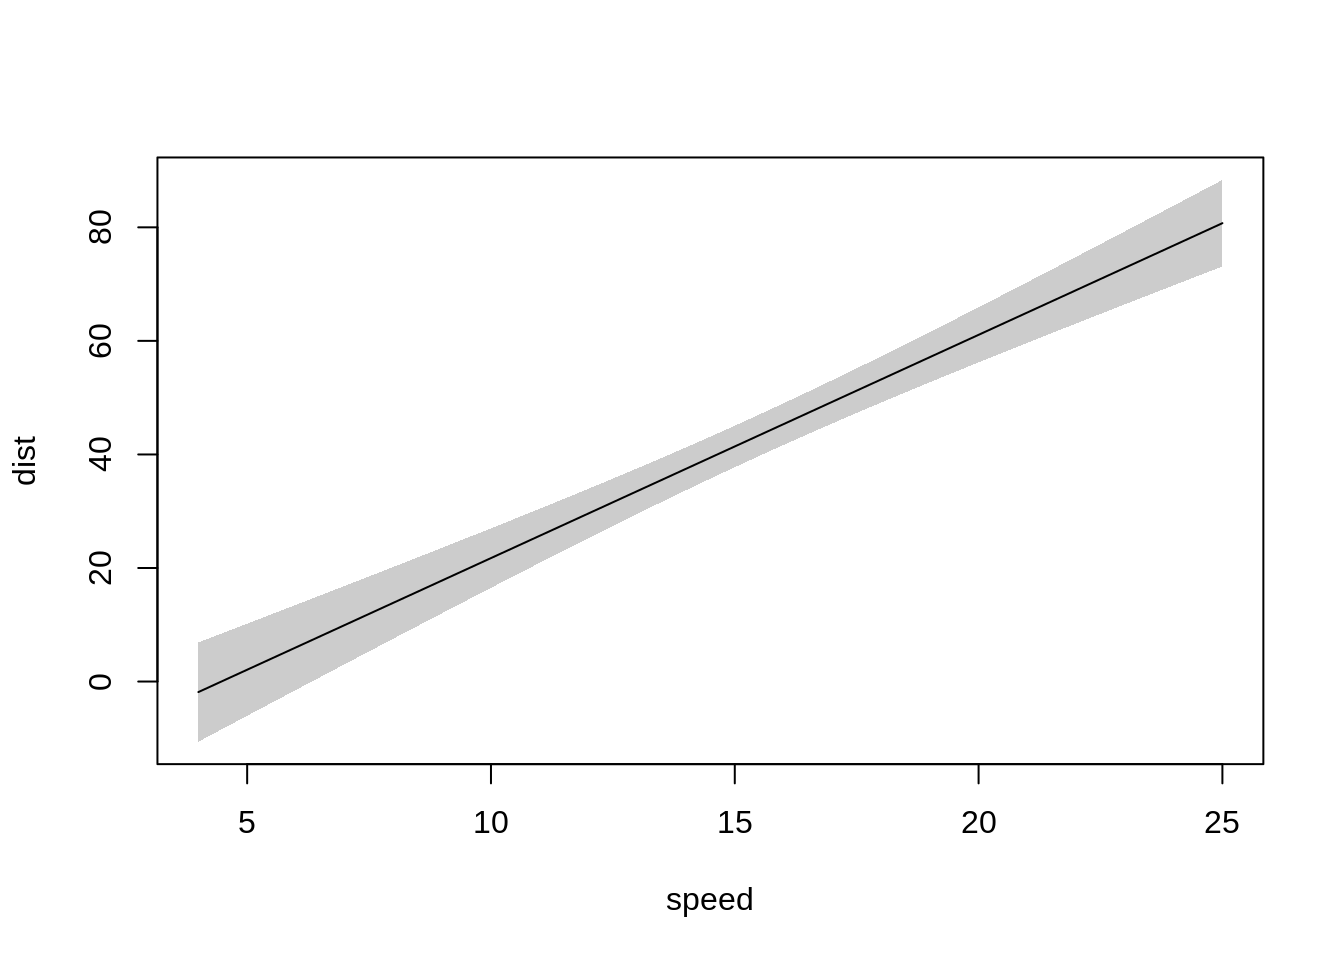
# Use `type_lm()` to pass extra arguments for customization
tinyplot(Sepal.Width ~ Petal.Width, data = iris, type = type_lm(level = 0.8))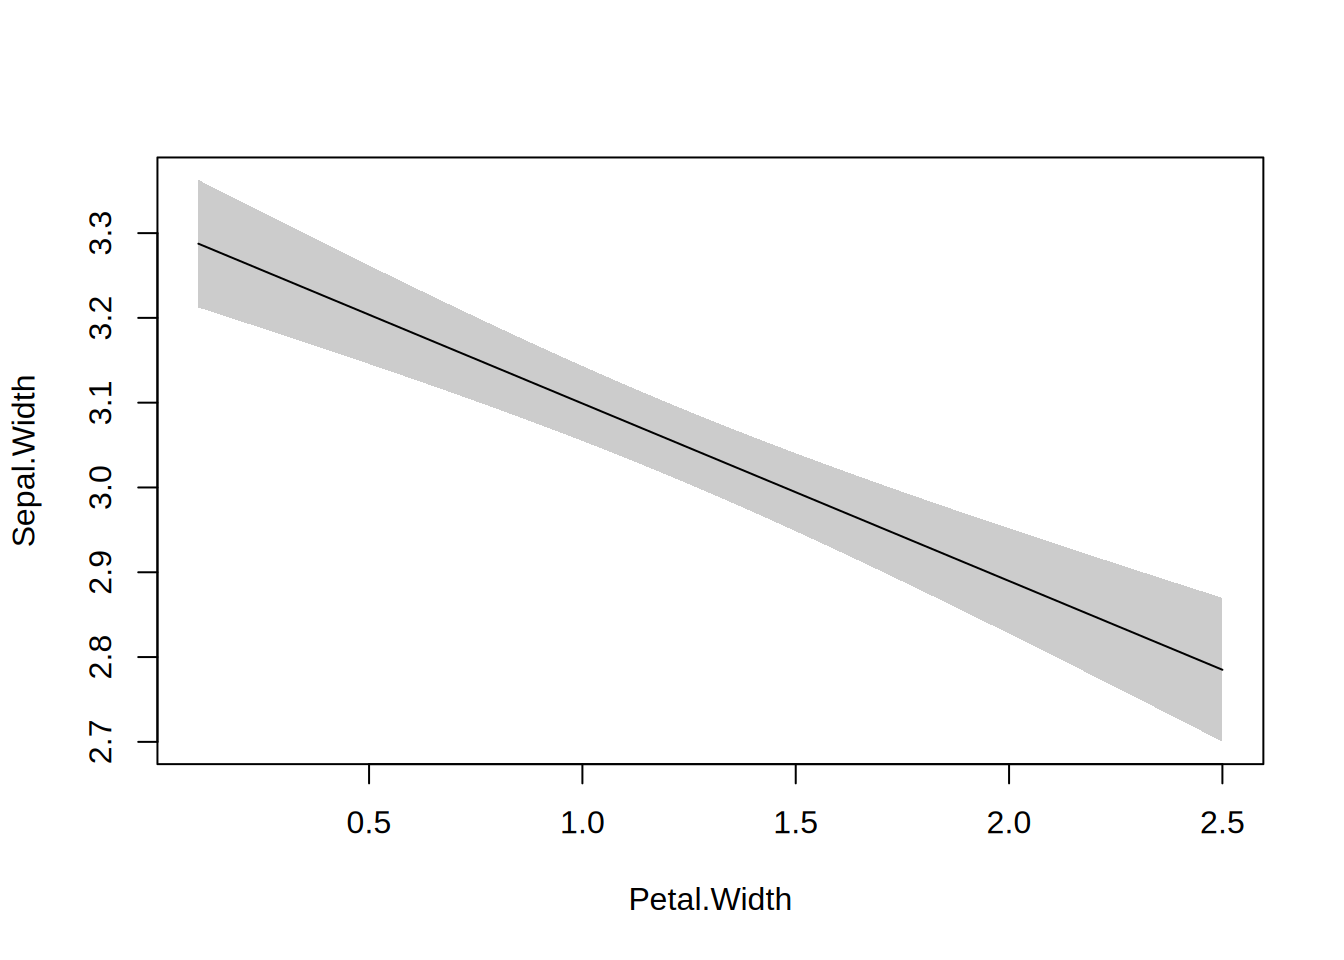
# Weighted fit example, either as a top-level argument (which supports
# non-standard evaluation in the formula method)...
s77 = as.data.frame(state.x77)
tinyplot(`Life Exp` ~ Income, data = s77, type = "lm", weights = Population)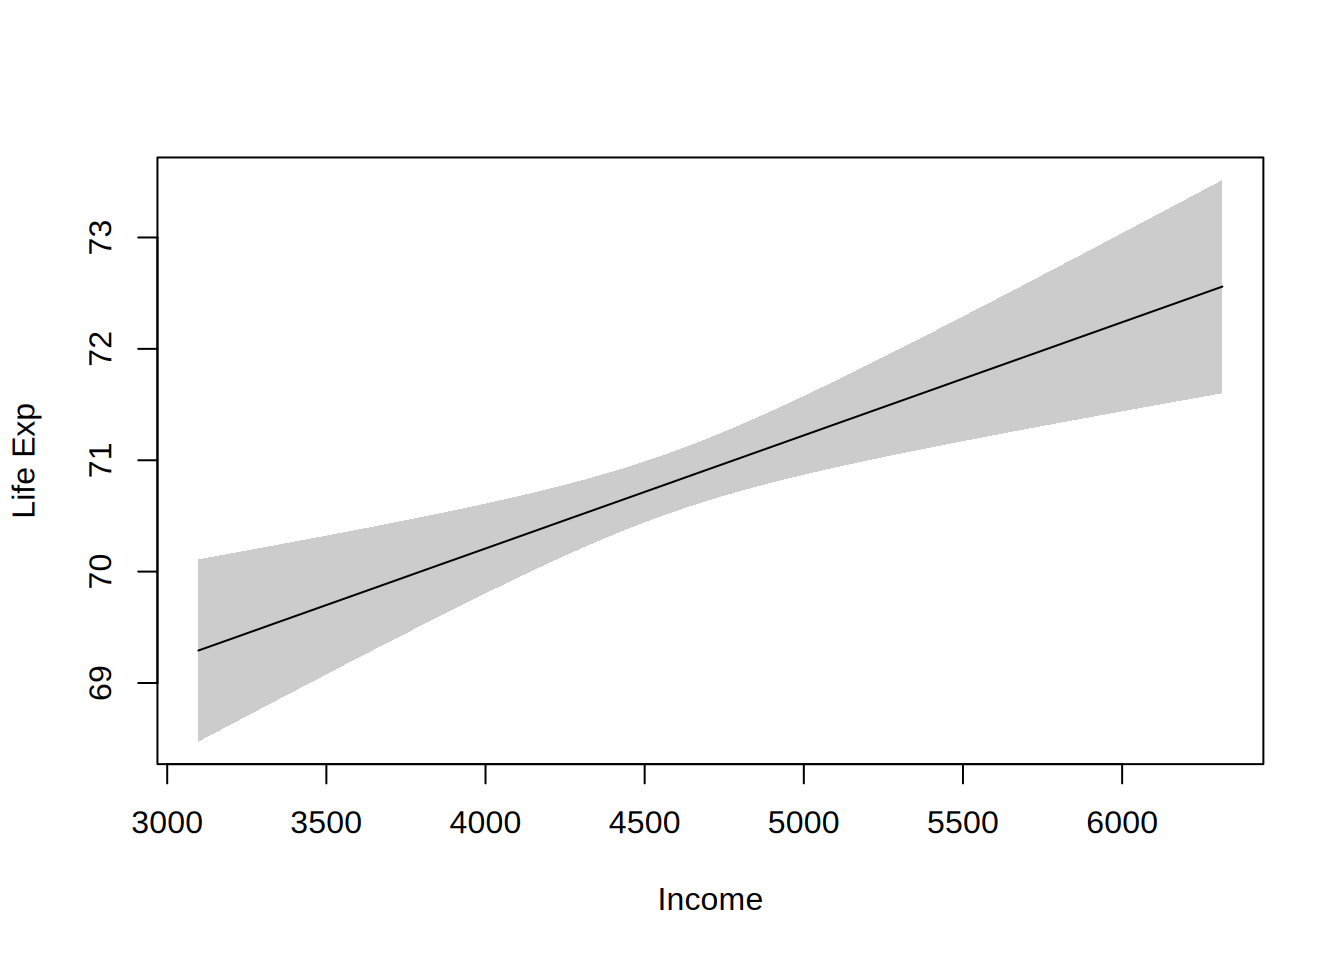
# ...or directly via the type constructor (requires an evaluated vector)
tinyplot(`Life Exp` ~ Income, data = s77, type = type_lm(
  weights = s77$Population))