library("tinyplot")

tinyplot(Sepal.Width ~ Sepal.Length | Species,
  facet = ~Species,
  data = iris)

tinyplot_add(type = "lm") ## or : plt_add(type = "lm")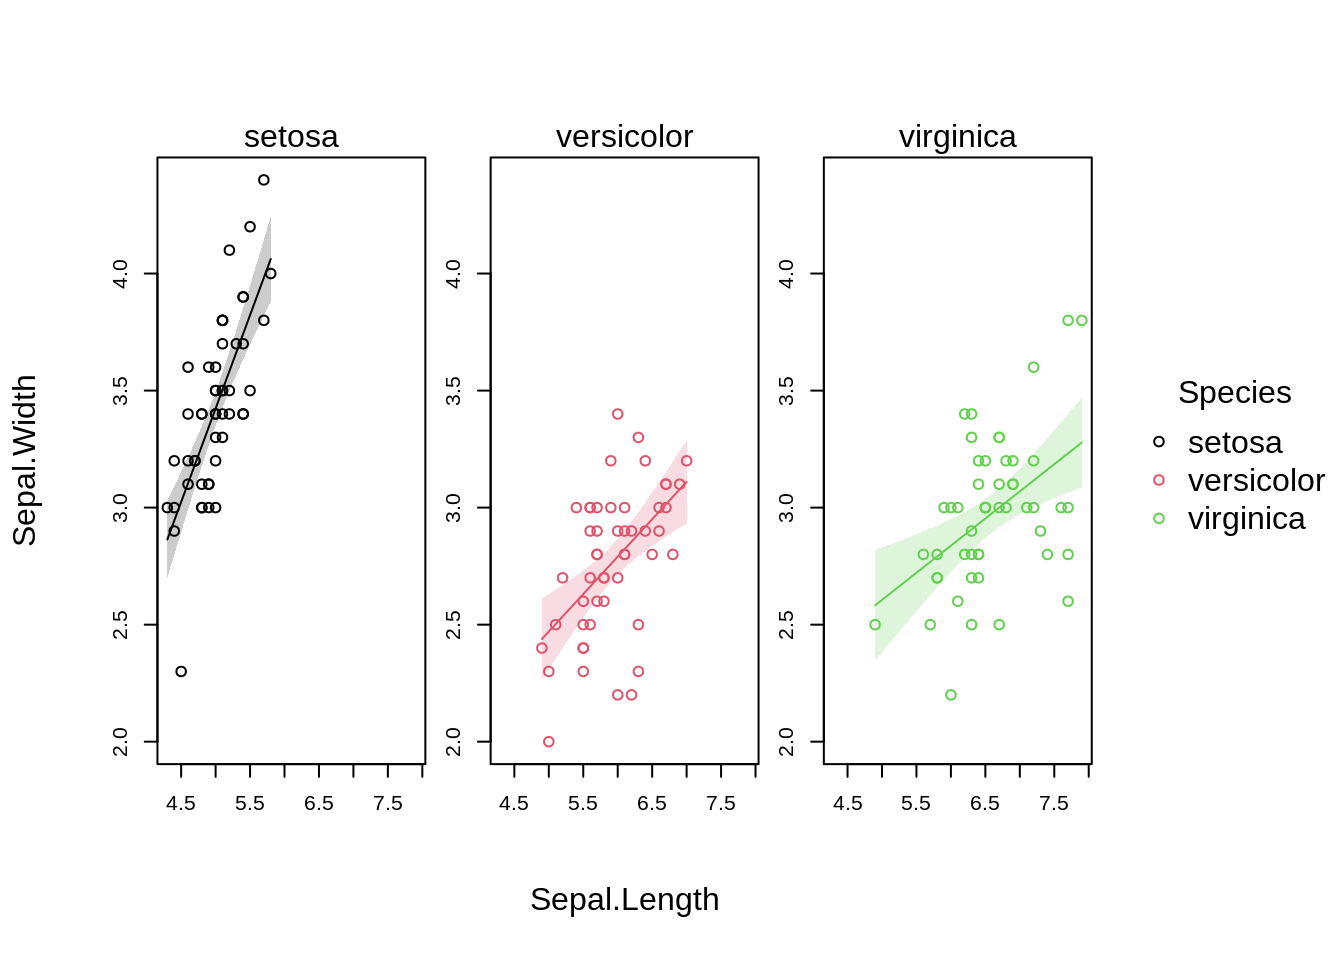
## Note: the previous function is equivalent to (but much more convenient
## than) re-writing the full call with the new type and `add=TRUE`:
# tinyplot(Sepal.Width ~ Sepal.Length | Species,
# facet = ~Species,
# data = iris,
# type = "lm",
# add = TRUE)
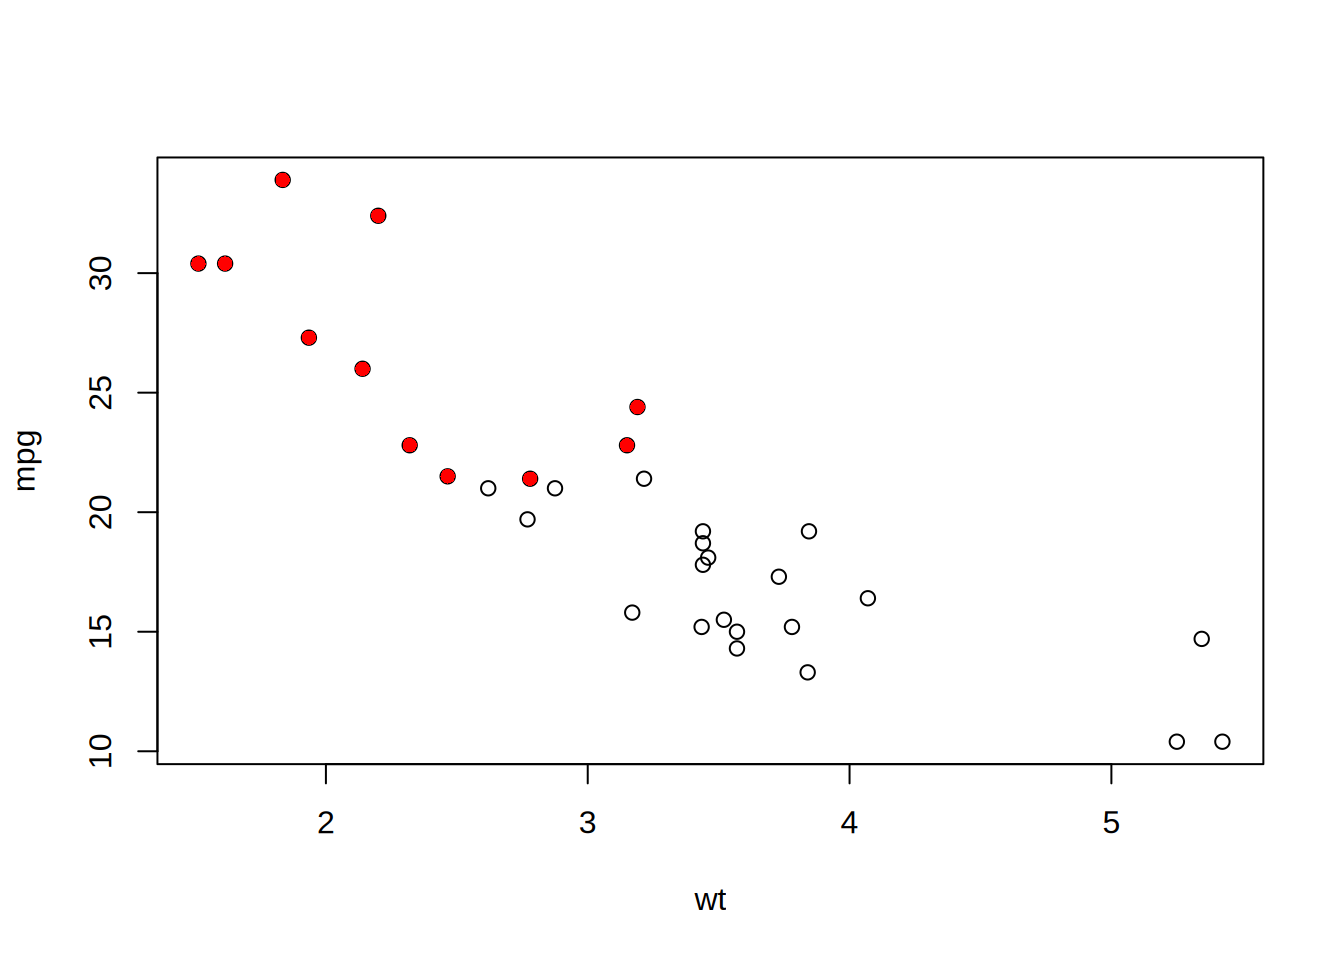
## Arguments relying on non-standard evaluation (e.g. `subset`) work too:
tinyplot(mpg ~ wt, data = mtcars)
tinyplot_add(subset = cyl == 4, col = "red", pch = 16)