library("tinyplot")
# "loess" type convenience string
tinyplot(dist ~ speed, data = cars, type = "loess")
# Use `type_loess()` to pass extra arguments for customization
tinyplot(dist ~ speed, data = cars, type = type_loess(span = 0.5, degree = 1))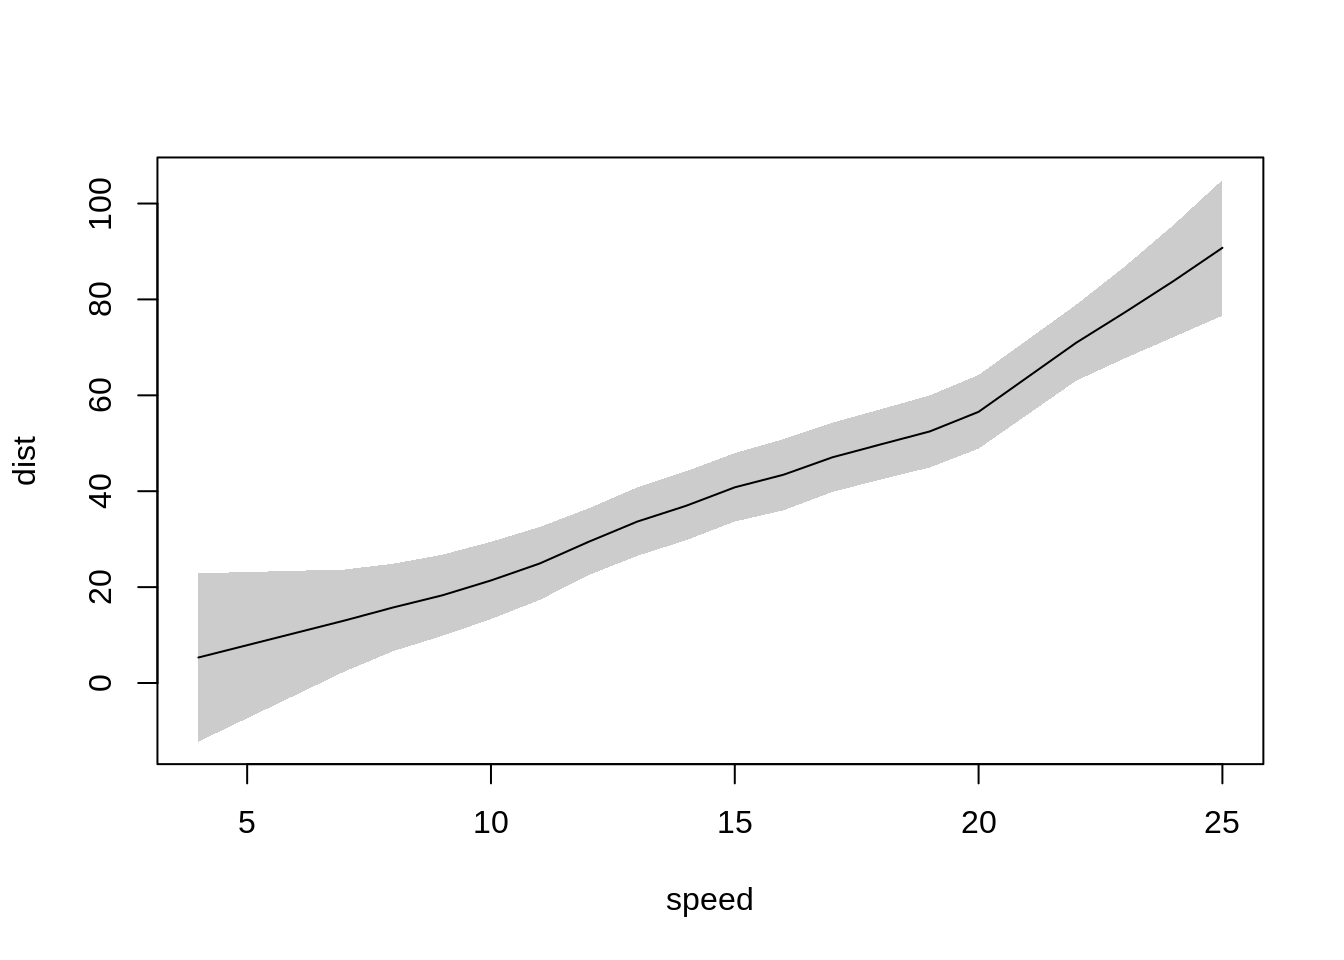
Type function for plotting a LOESS (LOcal regrESSion) fit. Arguments are passed to loess.
type_loess(
  span = 0.75,
  degree = 2,
  family = "gaussian",
  control = loess.control(),
  se = TRUE,
  level = 0.95,
  weights = NULL
)
span
|
the parameter \(\alpha\) which controls the degree of smoothing. |
degree
|
the degree of the polynomials to be used, normally 1 or 2. (Degree 0 is also allowed, but see the ‘Note’.) |
family
|
a description of the error distribution and link function to be used in the model. For glm this can be a character string naming a family function, a family function or the result of a call to a family function. For glm.fit only the third option is supported. (See family for details of family functions.)
|
control
|
control parameters: see loess.control.
|
se
|
logical. If TRUE (the default), confidence intervals are drawn.
|
level
|
the confidence level required if se = TRUE. Default is 0.95.
|
weights
|
an optional numeric vector of observation weights for the model fit, of the same length as the number of data points. Weights can also be supplied via the top-level weights argument of tinyplot (which is evaluated with non-standard evaluation in the formula method, and takes precedence if both are given).
|
library("tinyplot")

# "loess" type convenience string
tinyplot(dist ~ speed, data = cars, type = "loess")
# Use `type_loess()` to pass extra arguments for customization
tinyplot(dist ~ speed, data = cars, type = type_loess(span = 0.5, degree = 1))