Spline plot type

Description

Type function for plotting a cubic (or Hermite) spline interpolation. Arguments are passed to spline; see this latter function for default argument values.

Usage

type_spline(
  n = NULL,
  method = "fmm",
  xmin = NULL,
  xmax = NULL,
  xout = NULL,
  ties = mean
)

Arguments

n if xout is left unspecified, interpolation takes place at n equally spaced points spanning the interval [xmin, xmax].
method specifies the type of spline to be used. Possible values are “fmm”, “natural”, “periodic”, “monoH.FC” and “hyman”. Can be abbreviated.
xmin, xmax left-hand and right-hand endpoint of the interpolation interval (when xout is unspecified).
xout an optional set of values specifying where interpolation is to take place.
ties handling of tied x values. The string “ordered” or a function (or the name of a function) taking a single vector argument and returning a single number or a length-2 list of both, see approx and its ‘Details’ section, and the example below.

Details

See spline for further details on the available interpolation methods.

Examples

library("tinyplot")

# "spline" type convenience string
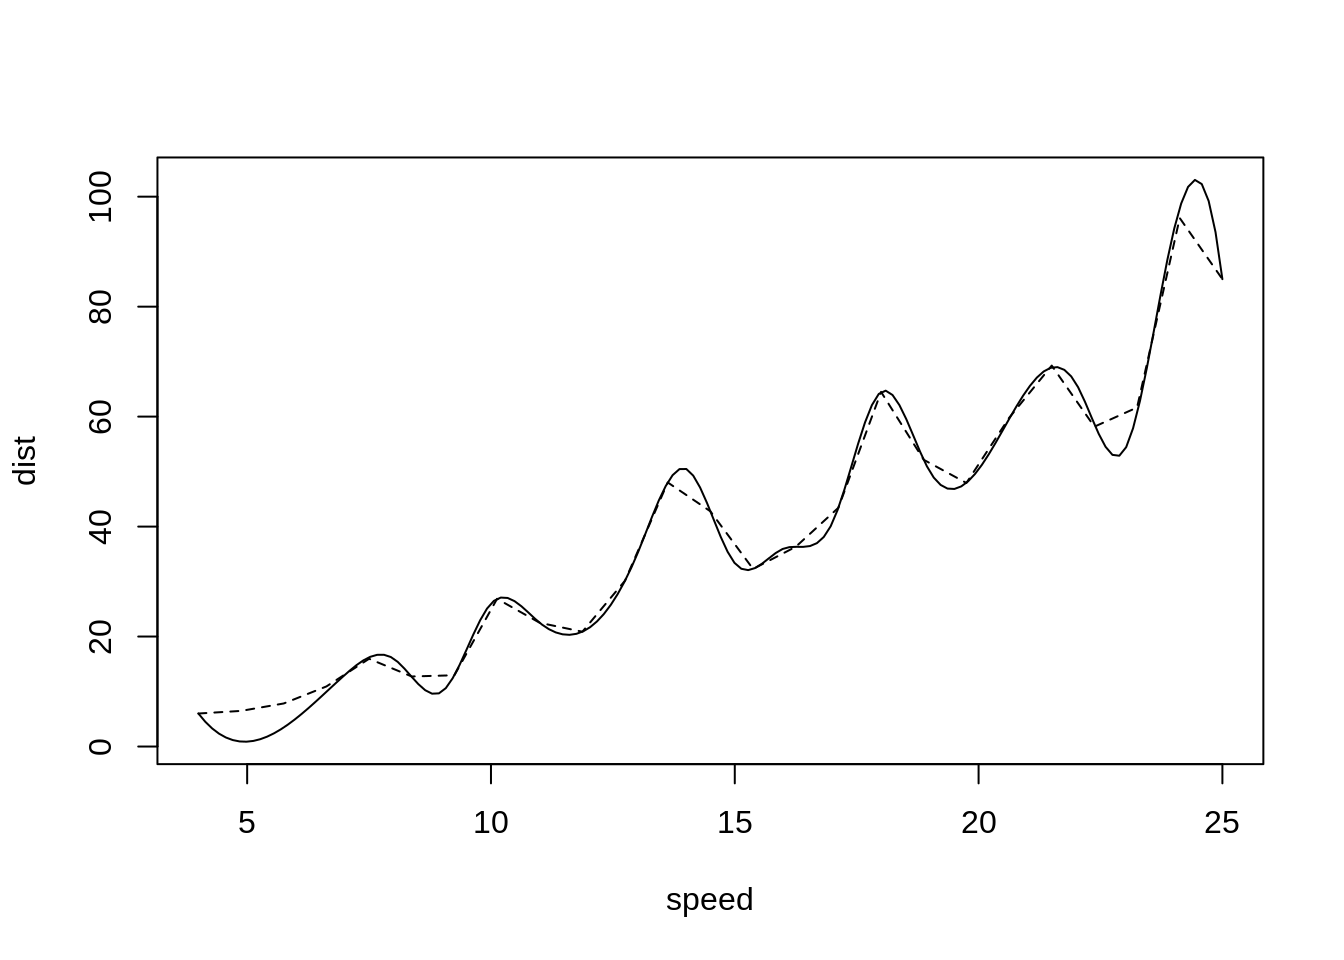
tinyplot(dist ~ speed, data = cars, type = "spline")

# Use `type_spline()` to pass extra arguments for customization
tinyplot(dist ~ speed,
    data = cars, type = type_spline(method = "natural", n = 25),
    add = TRUE, lty = 2)