range
|
this determines how far the plot whiskers extend out from the box. If range is positive, the whiskers extend to the most extreme data point which is no more than range times the interquartile range from the box. A value of zero causes the whiskers to extend to the data extremes.
|
width
|
a vector giving the relative widths of the boxes making up the plot.
|
varwidth
|
if varwidth is TRUE, the boxes are drawn with widths proportional to the square-roots of the number of observations in the groups.
|
notch
|
if notch is TRUE, a notch is drawn in each side of the boxes. If the notches of two plots do not overlap this is ‘strong evidence’ that the two medians differ (Chambers et al., 1983, p. 62). See boxplot.stats for the calculations used.
|
outline
|
if outline is not true, the outliers are not drawn (as points whereas S+ uses lines).
|
boxwex
|
a scale factor to be applied to all boxes. When there are only a few groups, the appearance of the plot can be improved by making the boxes narrower.
|
staplewex
|
staple line width expansion, proportional to box width.
|
outwex
|
outlier line width expansion, proportional to box width.
|
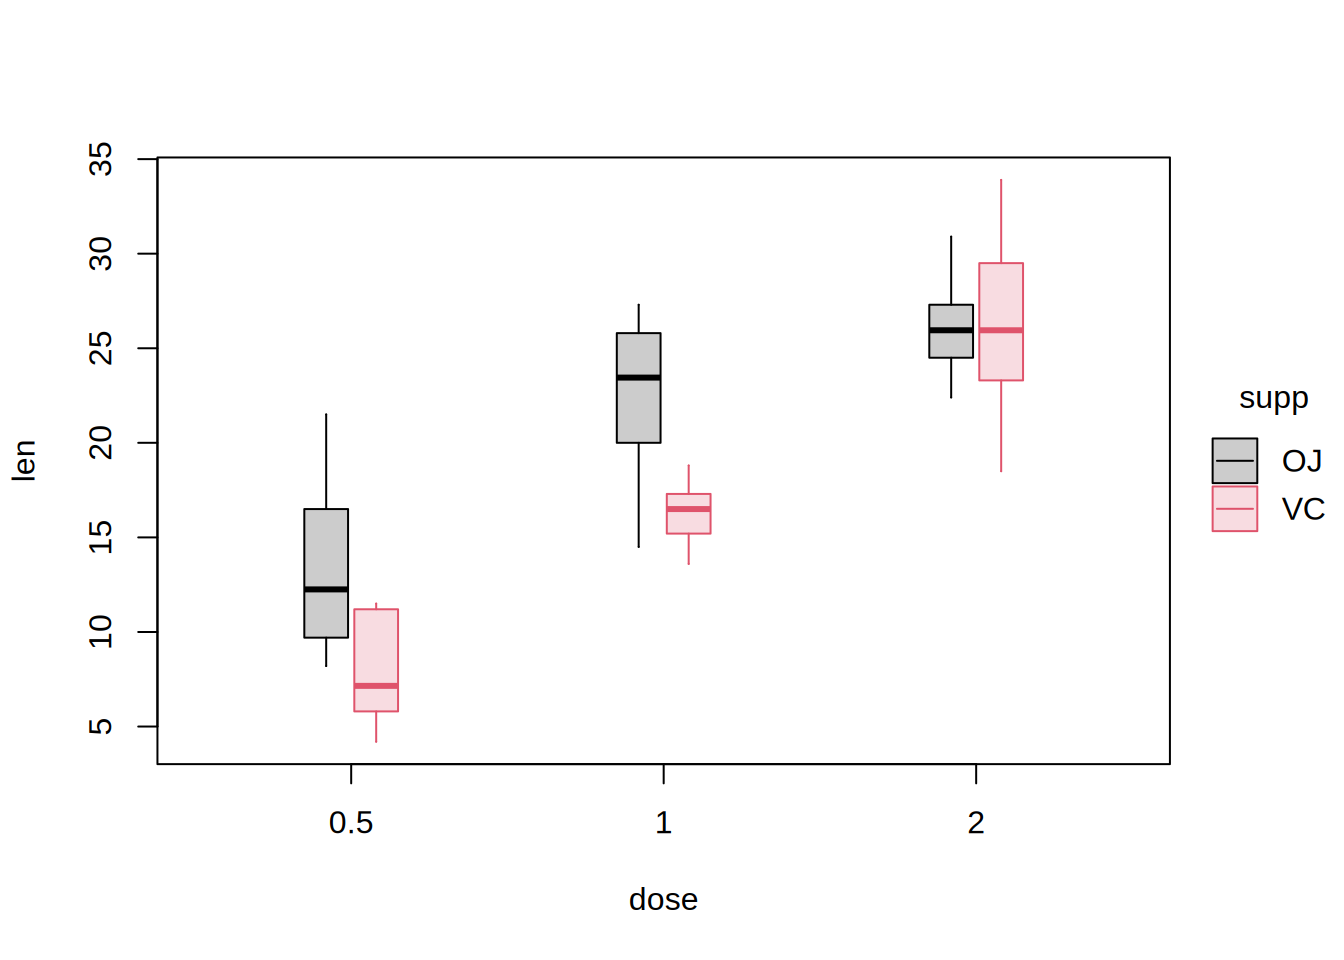
lighten
|
logical. Should the fills use a lighter, opaque tint of the series colour(s)? Default is TRUE, which keeps single- and multi-group displays consistent and lets the fill read cleanly over grid lines. Set to FALSE to use the fully-saturated palette colour(s) instead.
|