library("tinyplot")

tinytheme("basic")

#
## Basic coefficient plot(s)

mod = lm(mpg ~ wt * factor(am), mtcars)
coefs = data.frame(names(coef(mod)), coef(mod), confint(mod))
colnames(coefs) = c("term", "est", "lwr", "upr")

# "errorbar" and "pointrange" type convenience strings
tinyplot(est ~ term, ymin = lwr, ymax = upr, data = coefs, type = "errorbar")
tinyplot(est ~ term, ymin = lwr, ymax = upr, data = coefs, type = "pointrange")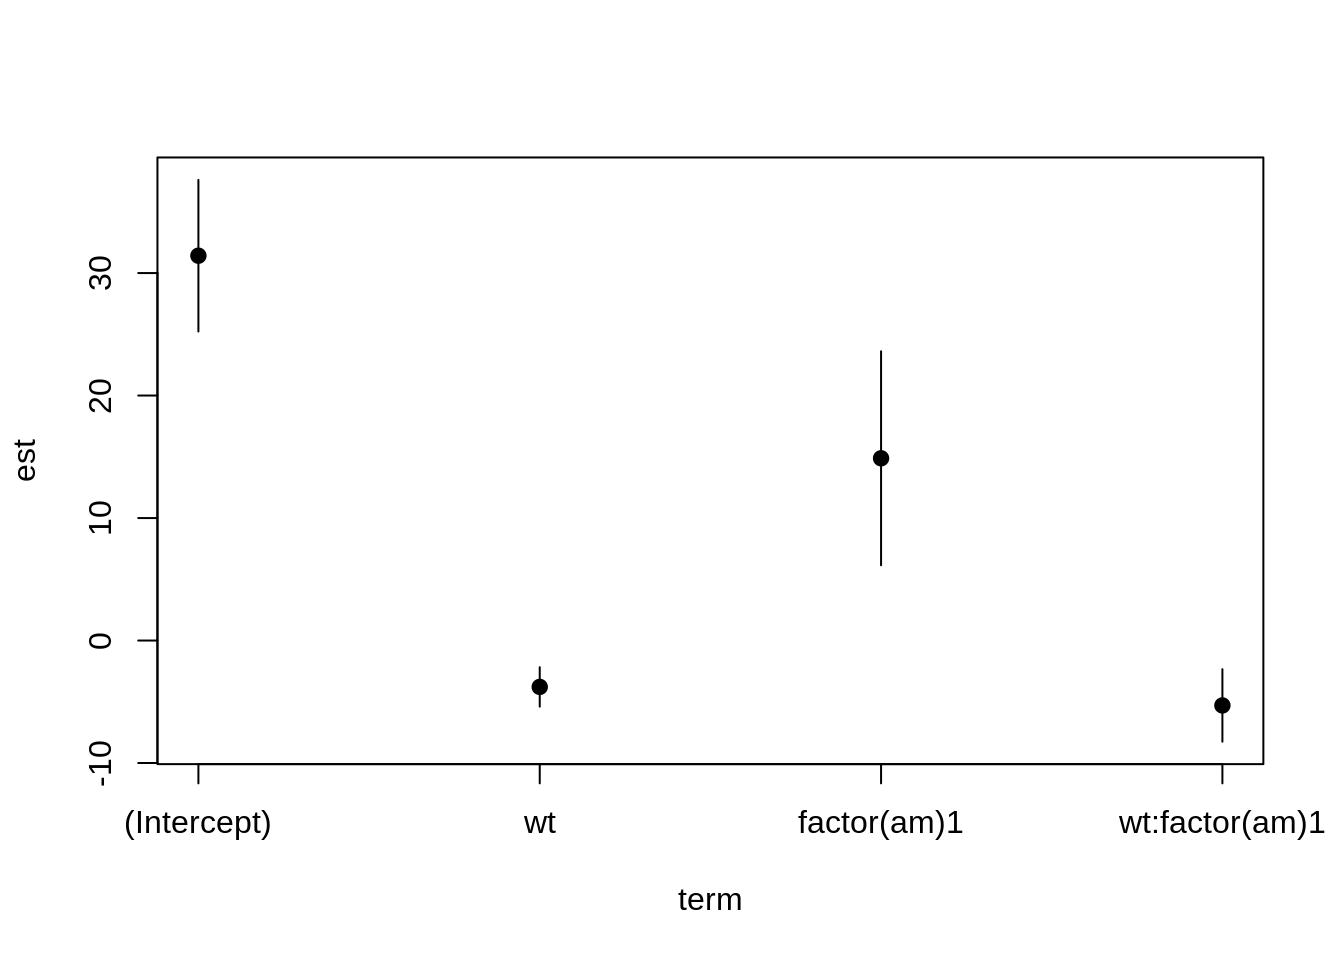
# Use `type_errorbar()` to pass extra arguments for customization
tinyplot(est ~ term, ymin = lwr, ymax = upr, data = coefs,
         type = type_errorbar(length = 0.2))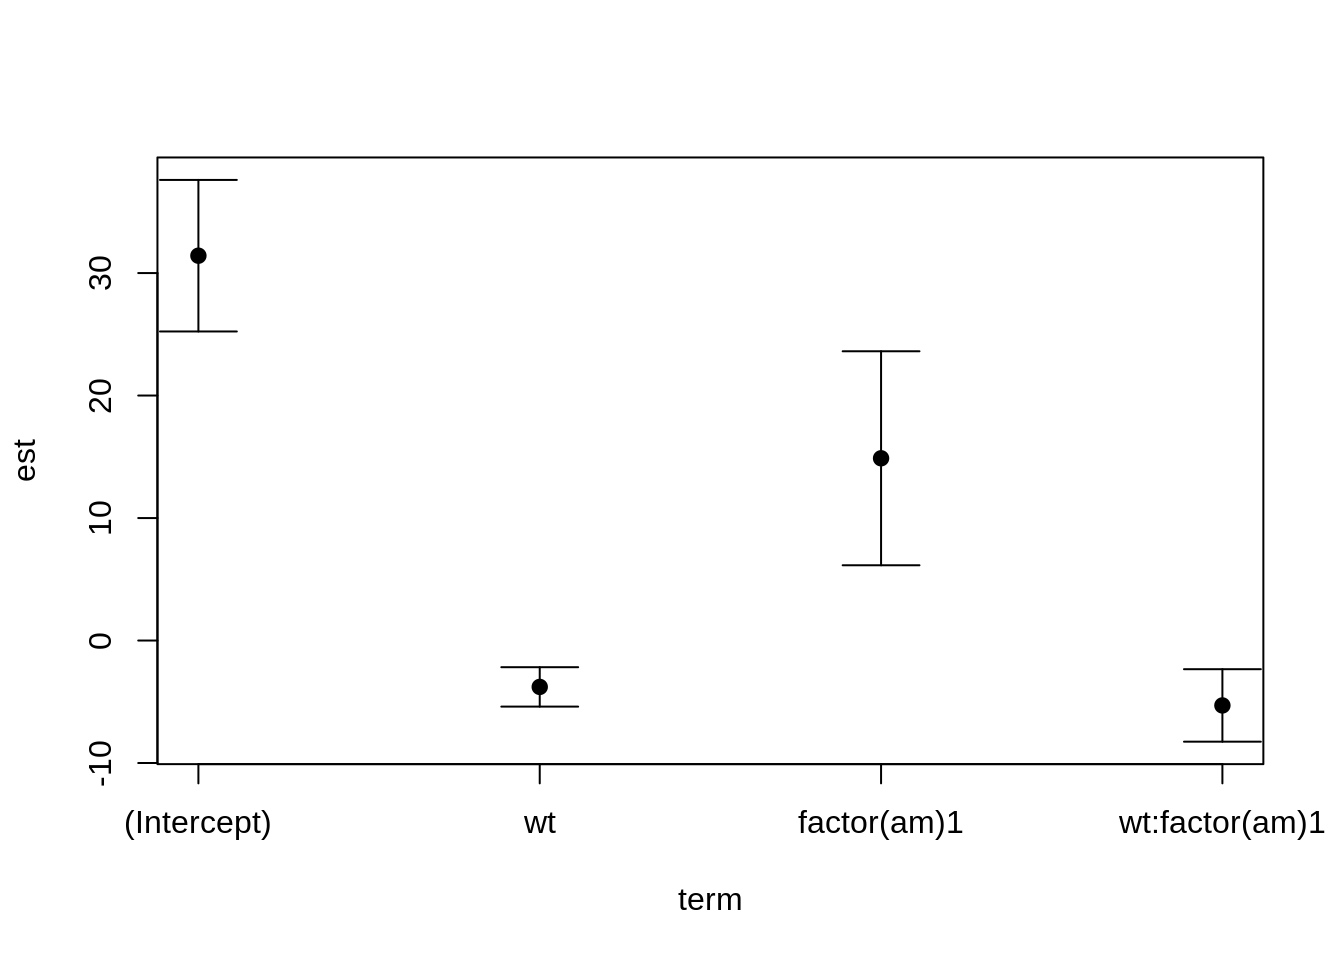
#
## Flipped plots

# For flipped errobar / pointrange plots, it is recommended to use a dynamic
# theme that applies horizontal axis tick labels

tinytheme("classic")
tinyplot(est ~ term, ymin = lwr, ymax = upr, data = coefs, type = "errorbar",
         flip = TRUE)
tinyplot_add(type = 'vline', lty = 2)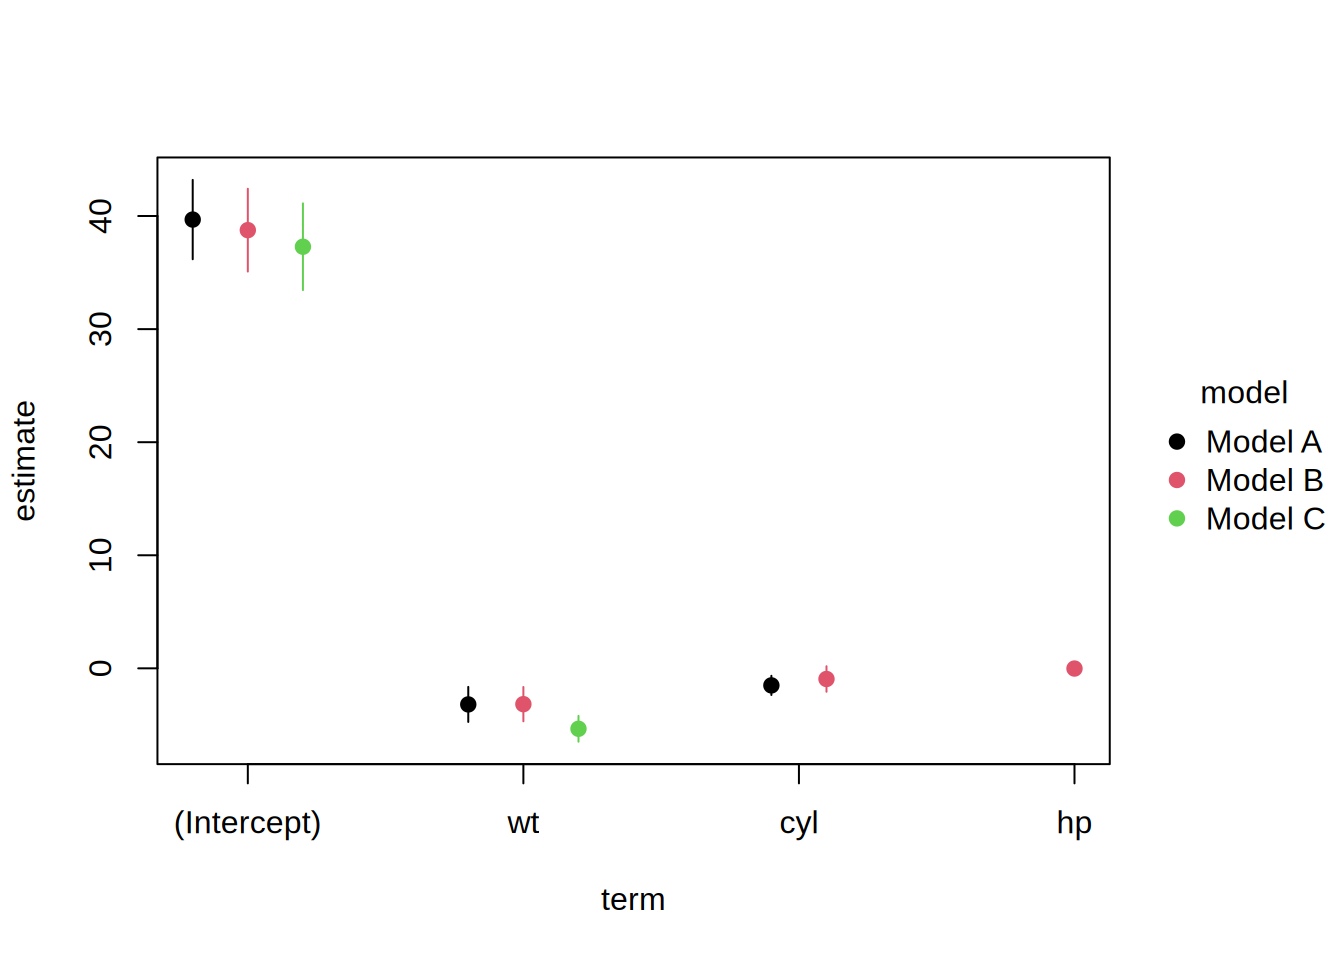
tinytheme("basic") # back to basic theme for the remaining examples

#
## Dodging groups

models = list(
    "Model A" = lm(mpg ~ wt, data = mtcars),
    "Model B" = lm(mpg ~ wt + cyl, data = mtcars),
    "Model C" = lm(mpg ~ wt + cyl + hp, data = mtcars)
)

models = do.call(
  rbind,
  lapply(names(models), function(m) {
    data.frame(
      model = m,
      term = names(coef(models[[m]])),
      estimate = coef(models[[m]]),
      setNames(data.frame(confint(models[[m]])), c("conf.low", "conf.high"))
    )
  })
)

tinyplot(estimate ~ term | model,
         ymin = conf.low, ymax = conf.high,
         data = models,
         type = type_pointrange(dodge = 0.1))
# Aside 1: relative vs fixed dodge
#  The default dodge position is based on the unique groups (here: models)
#  available to each x value (here: coefficient term). To "fix" the dodge
#  position across all x values, use `fixed.dodge = TRUE`.

tinyplot(estimate ~ term | model,
         ymin = conf.low, ymax = conf.high,
         data = models,
         type = type_pointrange(dodge = 0.1, fixed.dodge = TRUE))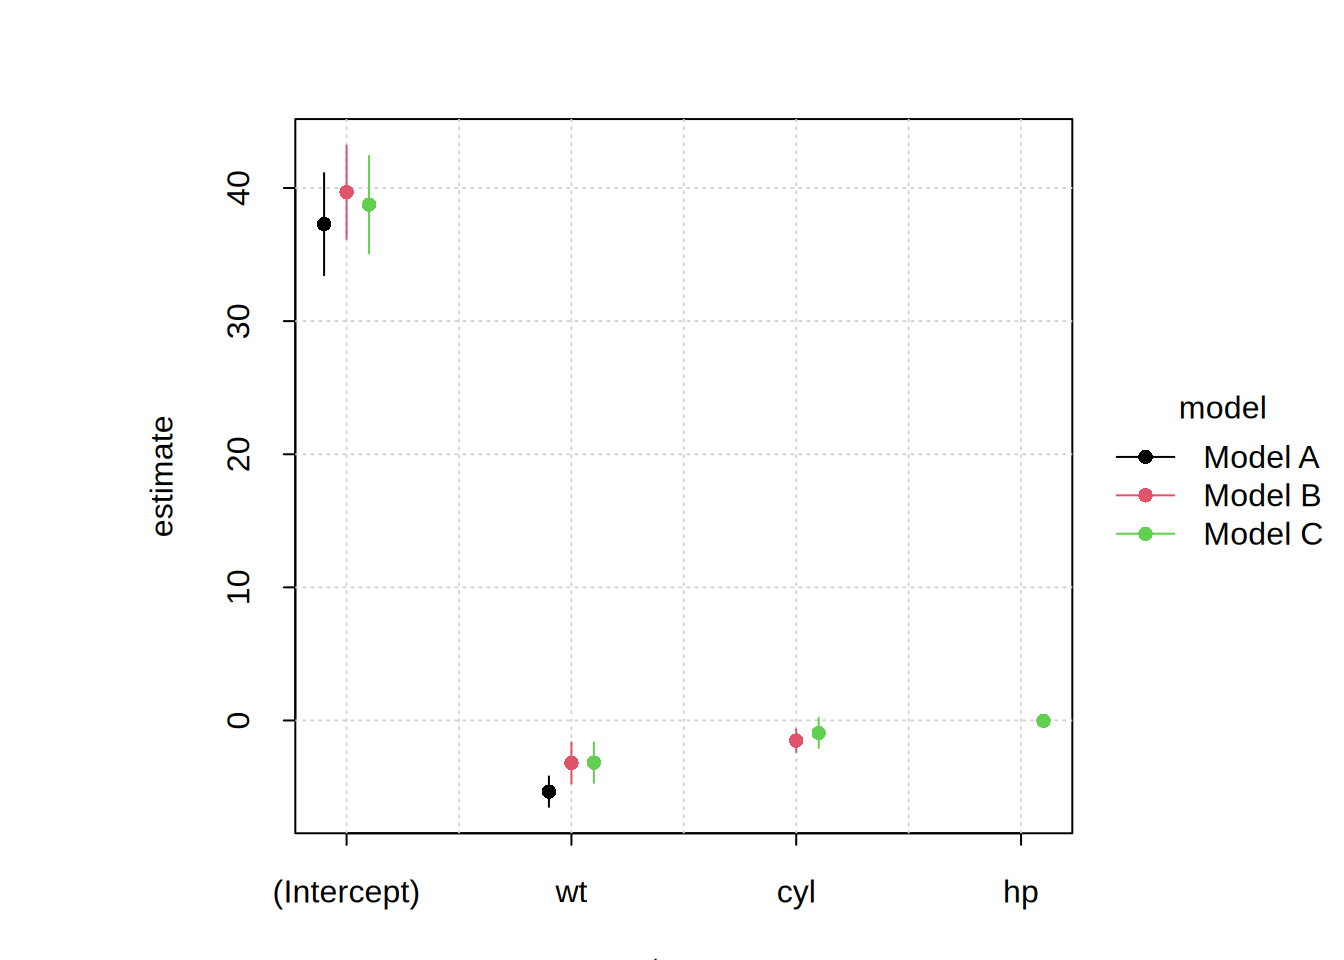
# Aside 2: layering
#  For layering on top of dodged plots, rather pass the dodging arguments
#  through the top-level call if you'd like the dodging behaviour to be
#  inherited automatically by the added layers.

tinyplot(estimate ~ term | model,
         ymin = conf.low, ymax = conf.high,
         data = models,
         type = "pointrange",
         dodge = 0.1, fixed.dodge = TRUE)
tinyplot_add(type = "l", lty = 2)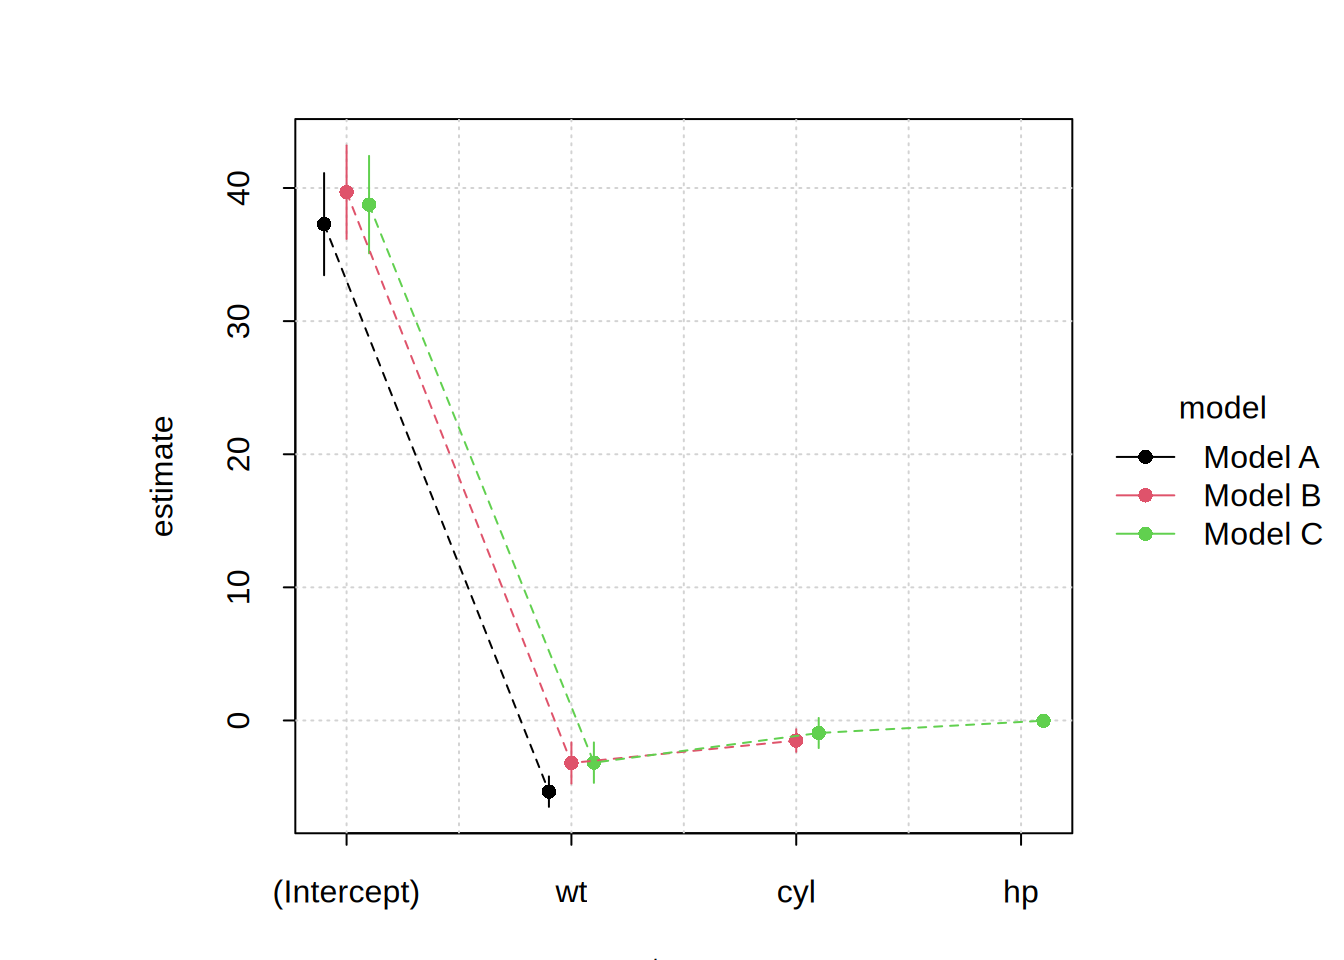
tinytheme() # reset theme