legend
|
Legend placement keyword or list, passed down from tinyplot.
|
legend_args
|
Additional legend arguments to be passed to legend.
|
by_dep
|
The (deparsed) "by" grouping variable name.
|
lgnd_labs
|
The labels passed to legend(legend = …).
|
labeller
|
Character or function for formatting the labels (lgnd_labs). Passed down to tinylabel.
|
type
|
Plotting type(s), passed down from tinyplot.
|
pch
|
Plotting character(s), passed down from tinyplot.
|
lty
|
Plotting linetype(s), passed down from tinyplot.
|
lwd
|
Plotting line width(s), passed down from tinyplot.
|
col
|
Plotting colour(s), passed down from tinyplot.
|
bg
|
Plotting character background fill colour(s), passed down from tinyplot.
|
cex
|
Plotting character expansion(s), passed down from tinyplot.
|
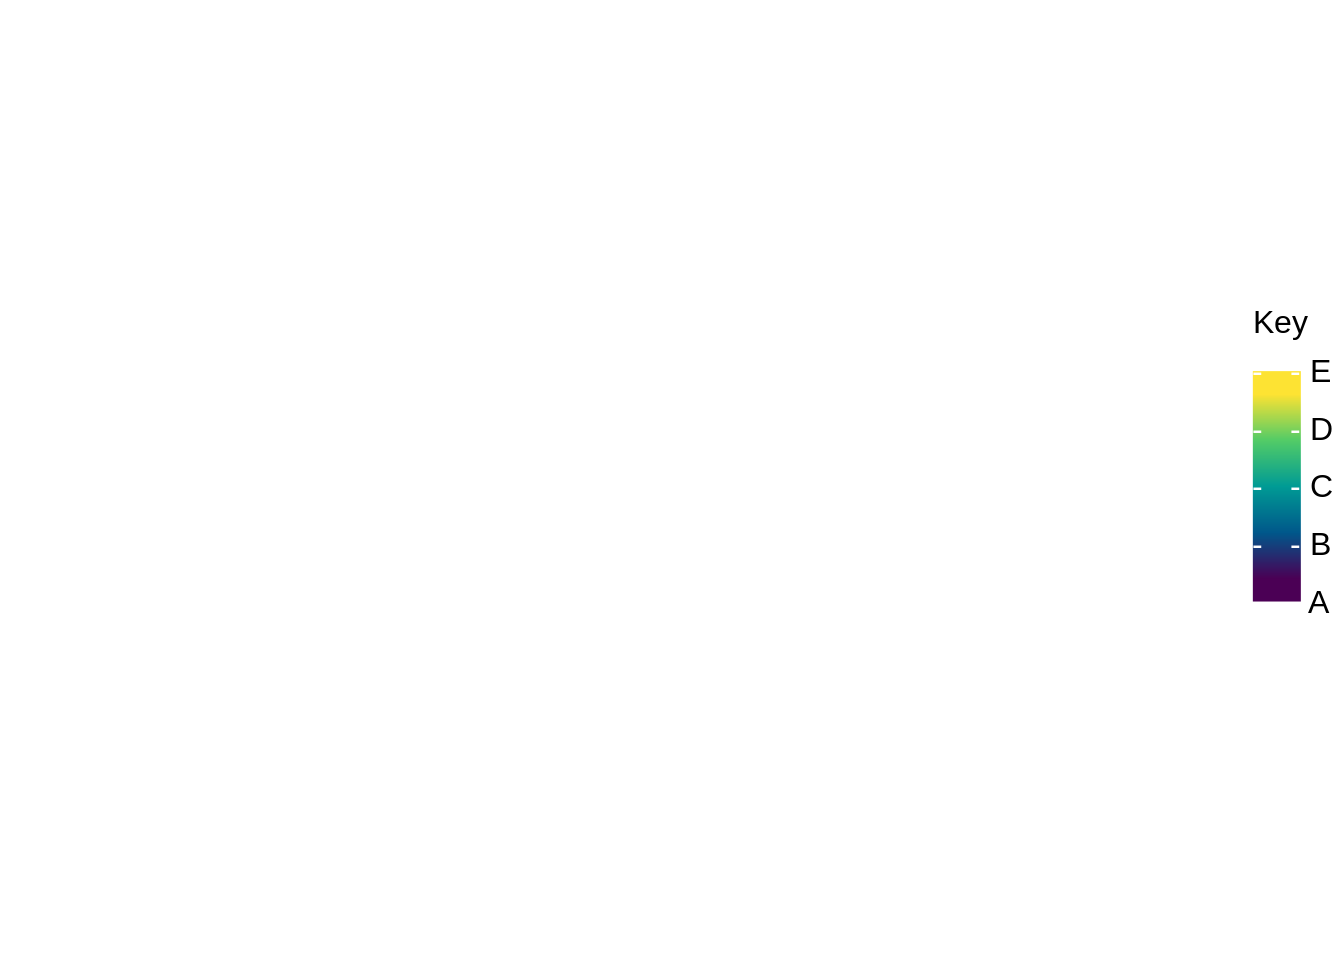
gradient
|
Logical indicating whether a continuous gradient swatch should be used to represent the colors.
|
lmar
|
Legend margins (in lines). Should be a numeric vector of the form c(inner, outer), where the first number represents the "inner" margin between the legend and the plot, and the second number represents the "outer" margin between the legend and edge of the graphics device. If no explicit value is provided by the user, then reverts back to tpar(“lmar”) for which the default values are c(1.0, 0.1).
|
has_sub
|
Logical. Does the plot have a sub-caption. Only used if keyword position is "bottom!", in which case we need to bump the legend margin a bit further.
|
has_cap
|
Logical. Does the plot have a caption. Only used if keyword position is "bottom!", in which case we need to bump the legend margin a bit further.
|
cap_text
|
Character. The caption text to draw below the legend when position is "bottom!". Ignored otherwise.
|
new_plot
|
Logical. Should we be calling plot.new internally?
|
draw
|
Logical. If FALSE, no legend is drawn but the sizes are returned. Note that a new (blank) plot frame will still need to be started in order to perform the calculations.
|
soma_target
|
Numeric. Shared outer margin target (in lines) for multi-legend alignment. If NULL, each legend computes its own margin.
|
dynmar_title_mar
|
Numeric or NULL. The pre-computed dynmar_computed[3] value for "top!" legends under dynmar themes. When set, the legend margin formula uses this directly to ensure correct title positioning.
|
type_hints
|
Optional named list of semantic behaviour properties that a plot type declares for itself (e.g. has_rhs_axis for a secondary right-hand axis, or legend_fills_from_col for a legend swatch fill taken from col). Passed down from tinyplot; defaults to NULL. Deliberately last, so that adding it did not shift the position of any pre-existing argument for positional callers.
|