Convenience interface for visualizing data.frame objects with tinyplot.
Usage
## S3 method for class 'data.frame'
tinyplot(x, formula = NULL, by = NULL, labs = FALSE, frames = FALSE, ...)

tinypairs(x, by = NULL, labs = FALSE, frames = FALSE, ...)
Arguments
x
an object of class “data.frame”.
formula
a formula that is passed on to tinyplot.formula. If formula is NULL a formula of type y ~ 1 or y ~ x is set up for 1- and 2-variable data frames, respectively. For data frames with 3 or more variables, a pairs-style grid of all variable combinations is drawn instead.
by
(pairs-case only) optional grouping variable. Either 1) a character string giving a column name in x, or 2) a vector of equal length to the main data.frame (caveat emptor: this is not checked). The variable is spliced into each sub-plot’s formula as y ~ x | by so groups are distinguished (e.g. by colour). Note that the legend is deliberately suppressed.
labs
(pairs-case only) logical indicating whether the axes labels (titles) for each sub-plot in the pairs-style case should be shown. Default is FALSE.
frames
(pairs-case only) logical indicating whether each sub-plot should be framed by a box. Default is FALSE. Note the trailing "s" plural case to disambiguate from frame.plot.
…
further arguments passed to tinyplot.
Details
This is a convenience function for plotting data frames with or without a formula. The case with the formula mainly facilitates using tinyplot() in combination with pipes. The case without formula provides a quick way of plotting the variables in a data frame: a single variable, a pair of variables, or a pairs-style grid of all variable combinations for 3 or more variables. The latter can be called directly (also for less than 3 variables) via tinypairs().
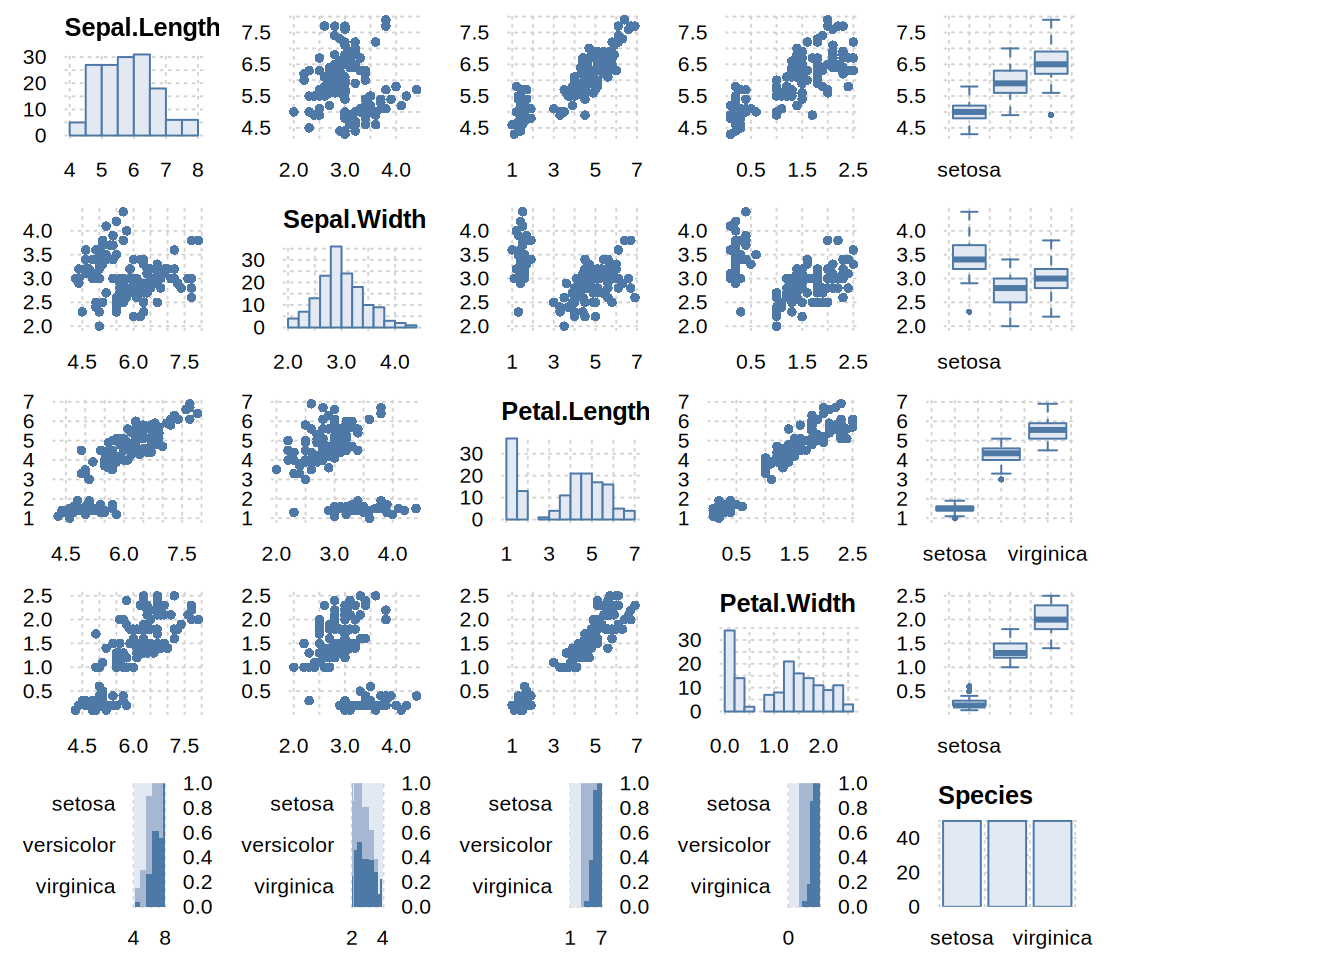
Note that, unlike a base pairs plot, these tinyplot variants (deliberately) produce a histogram for the univariate cases along the grid diagonal.
Value
No return value, called for the side effect of producing a plot.
Examples
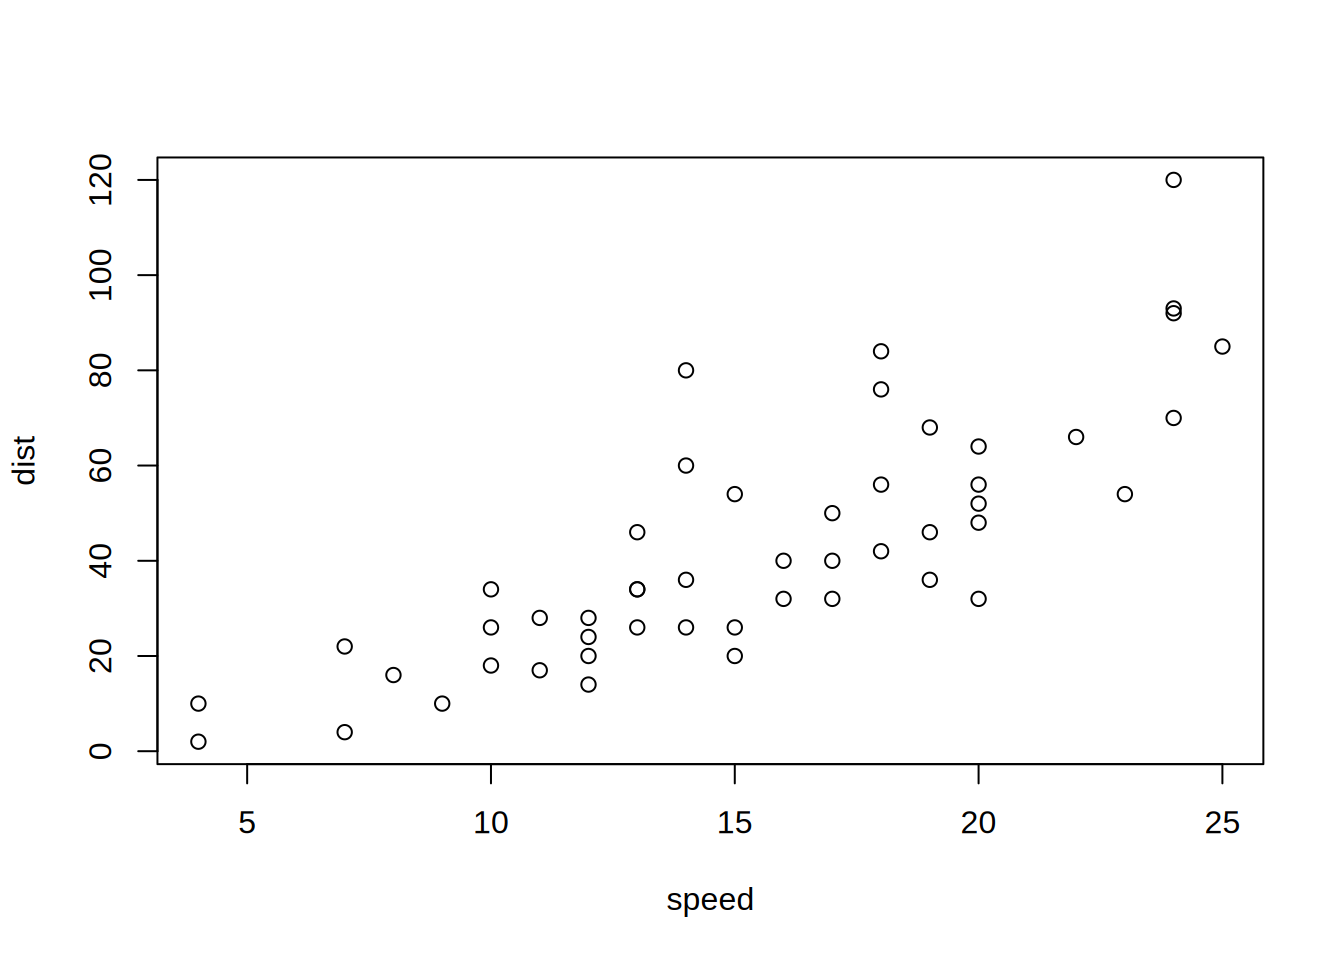
library("tinyplot")## using tinyplot() with data framestinyplot(cars)
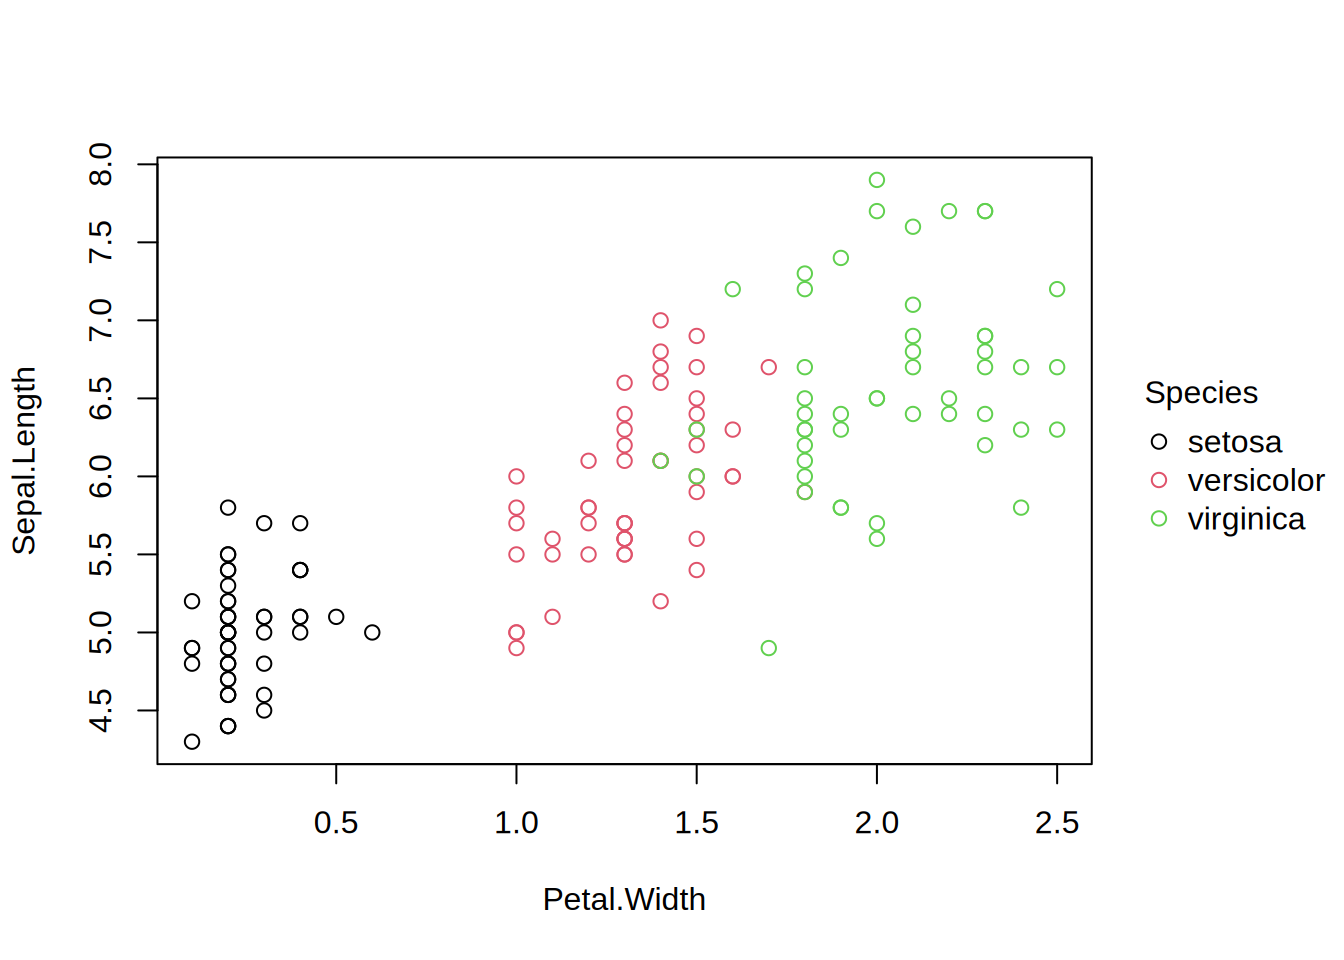
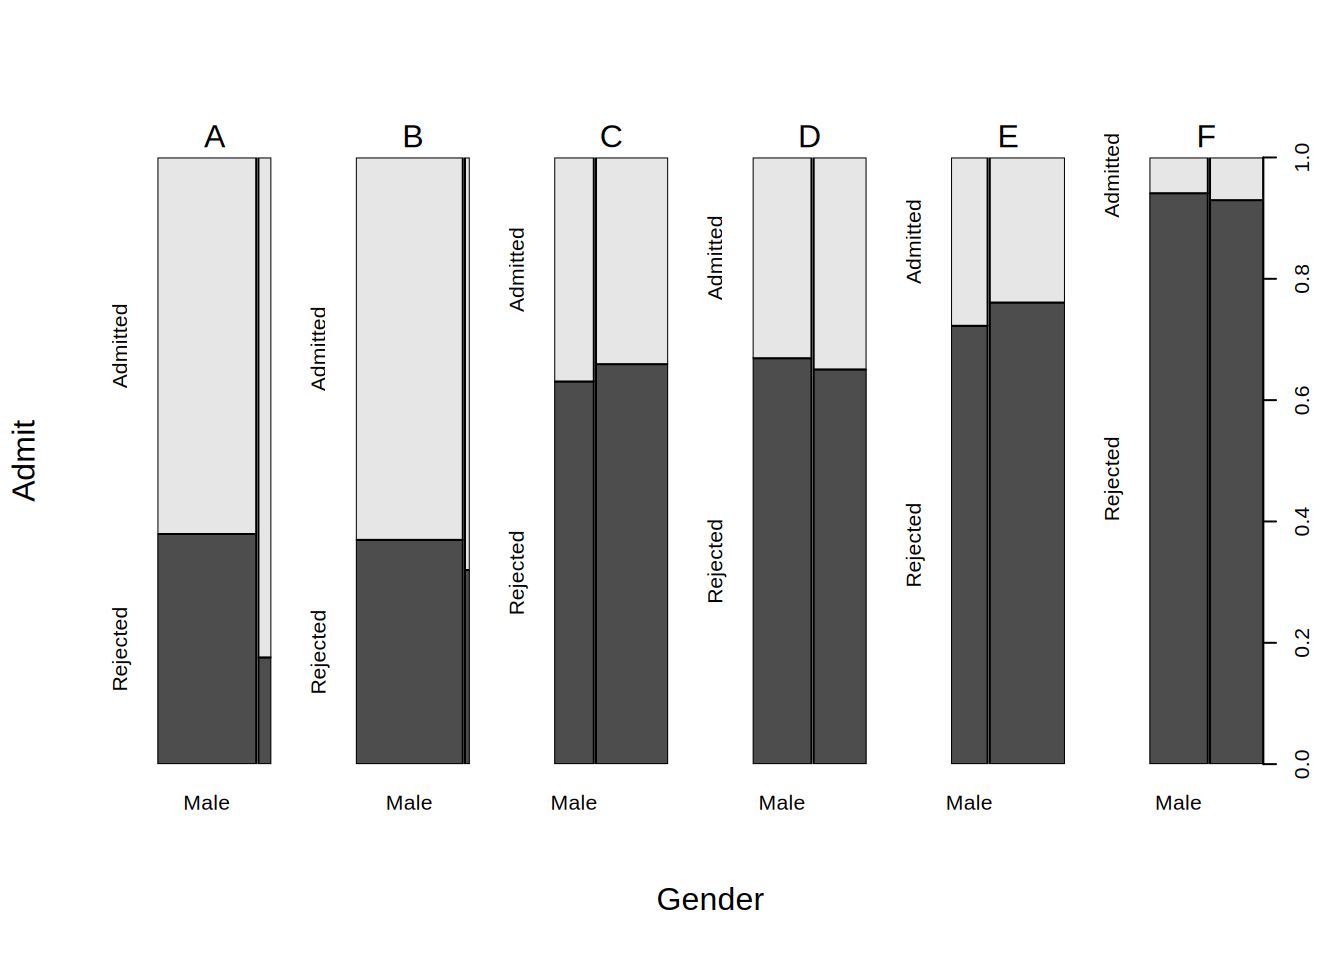
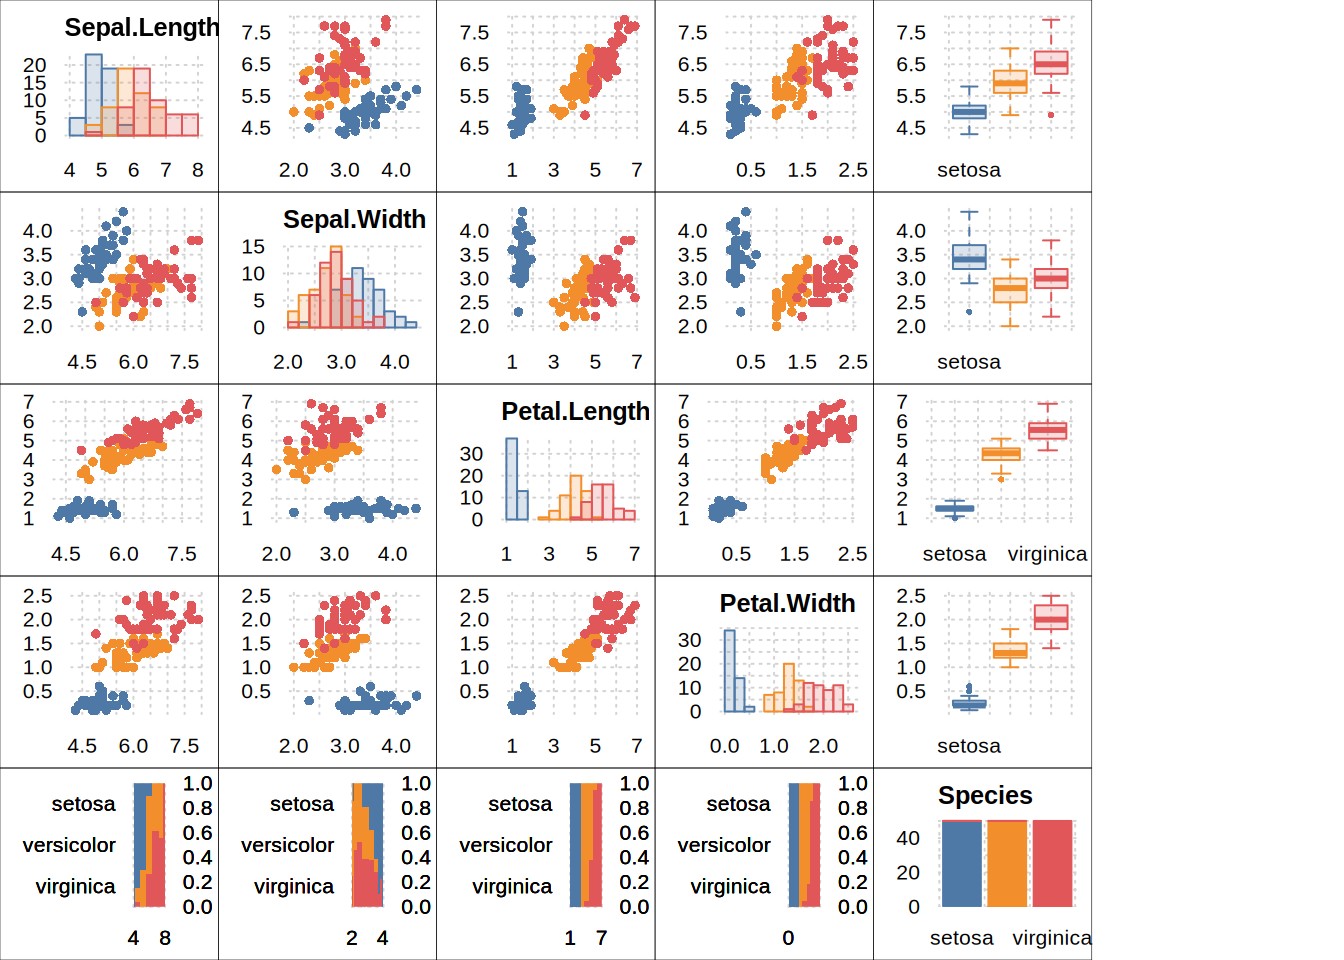
## note that this also enables usage with pipes (in R >= 4.1.0) such as# cars |> tinyplot()# iris |> tinyplot(Sepal.Length ~ Petal.Width | Species)# UCBAdmissions |> # as.data.frame() |># tinyplot(Admit ~ Gender, facet = 1 ~ Dept, weights = Freq)# etc.## pairs-style display for data frames with 3 or more variables## (works best with a theme)tinytheme("clean2")tinyplot(iris)
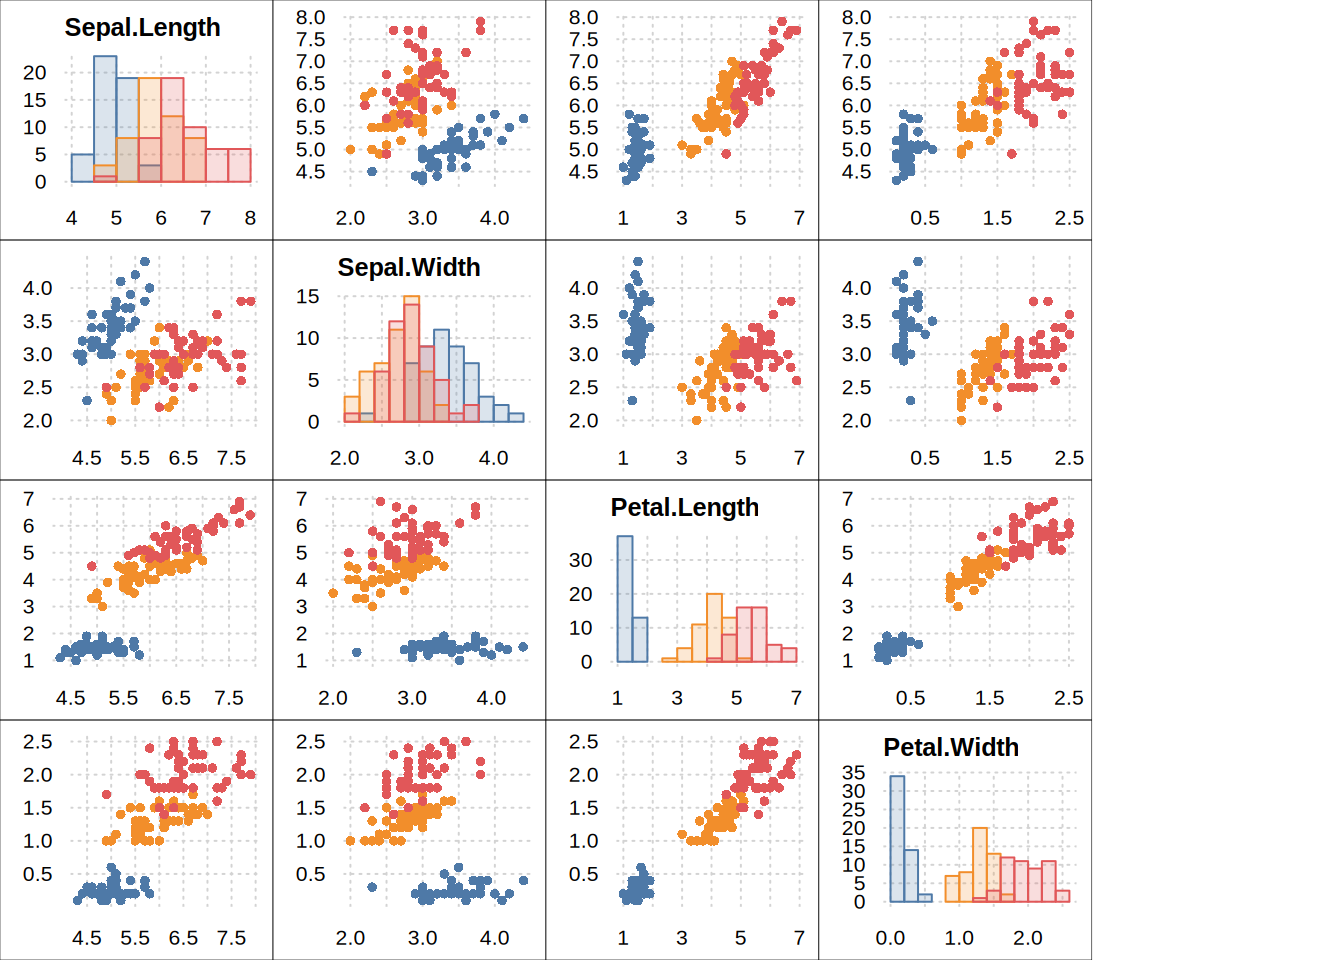
## pass `by` arg to group the pairs display (legend is suppressed)## here, we also add optional frames around the individual sub-plotstinyplot(iris, by ="Species", frames =TRUE)
## another option (but assumes objects of equal length)tinyplot(iris[, 1:4], by = iris$Species, frames =TRUE)
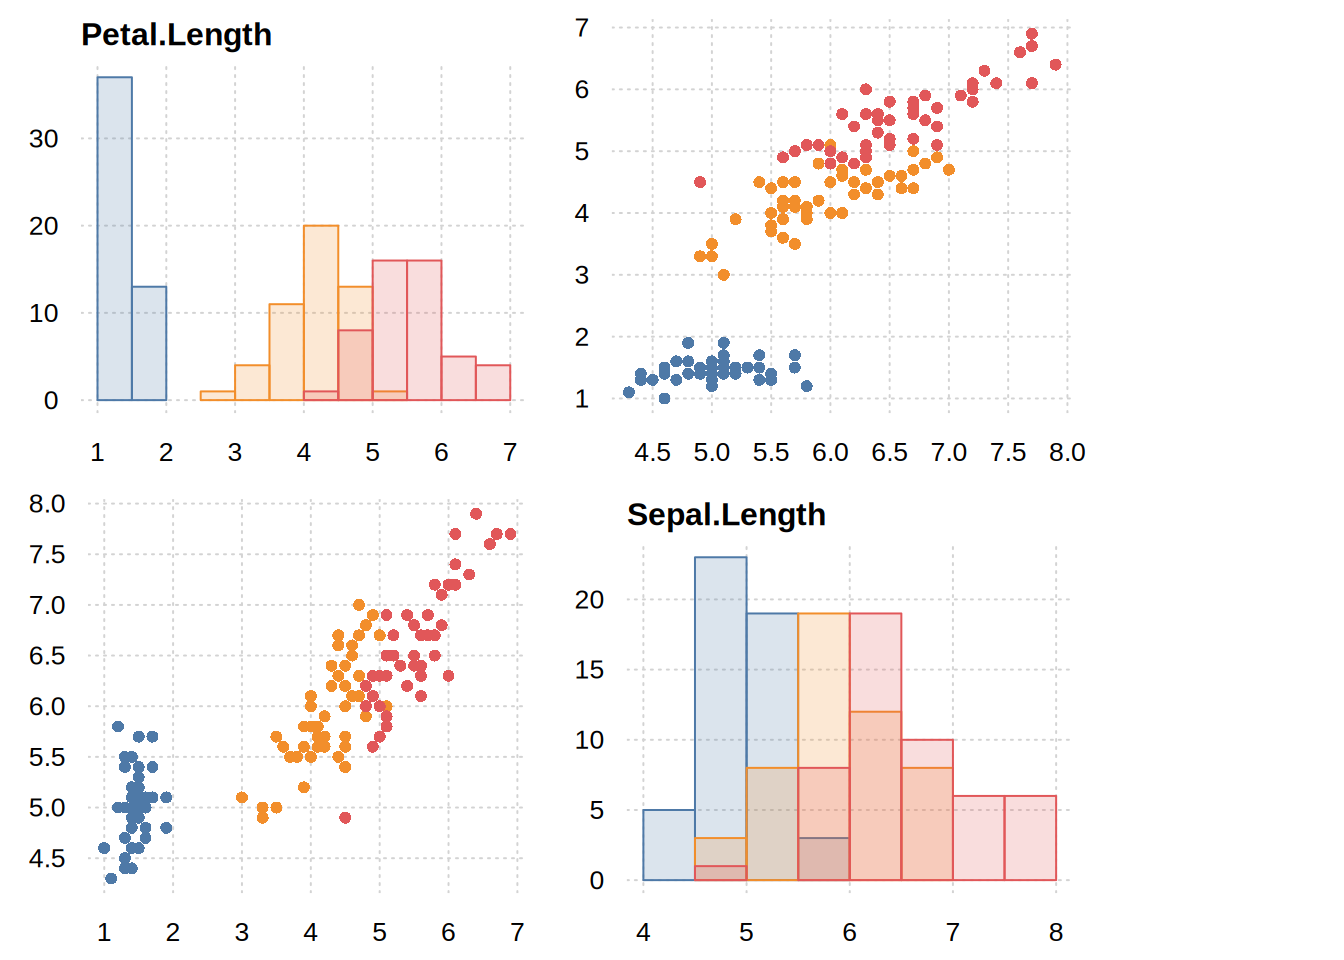
## tinypairs can also create 2x2 pairs displaytinypairs(iris[, c(3, 1)], by = iris$Species)