Details
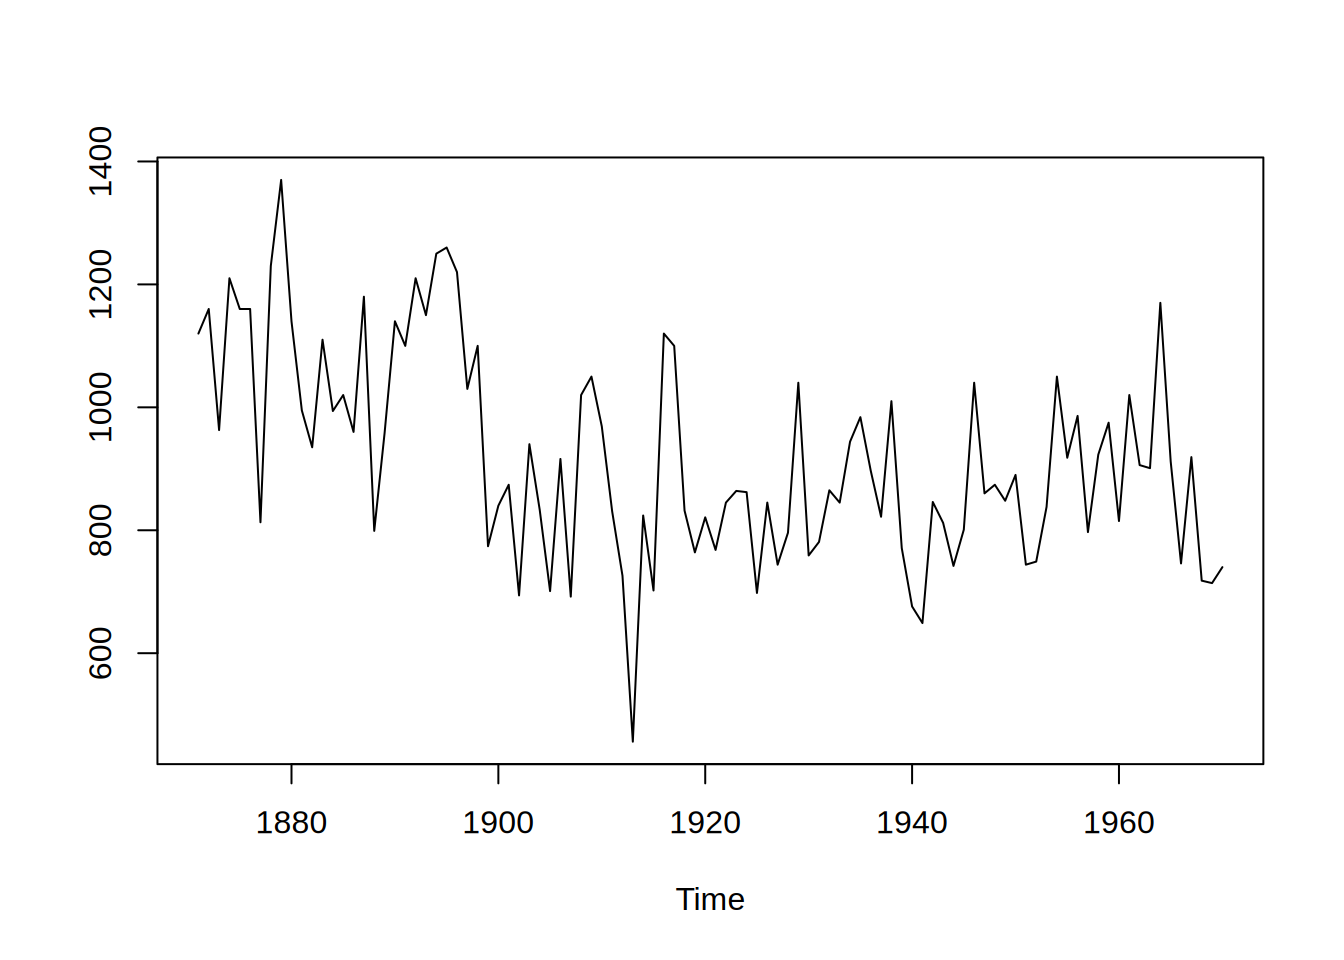
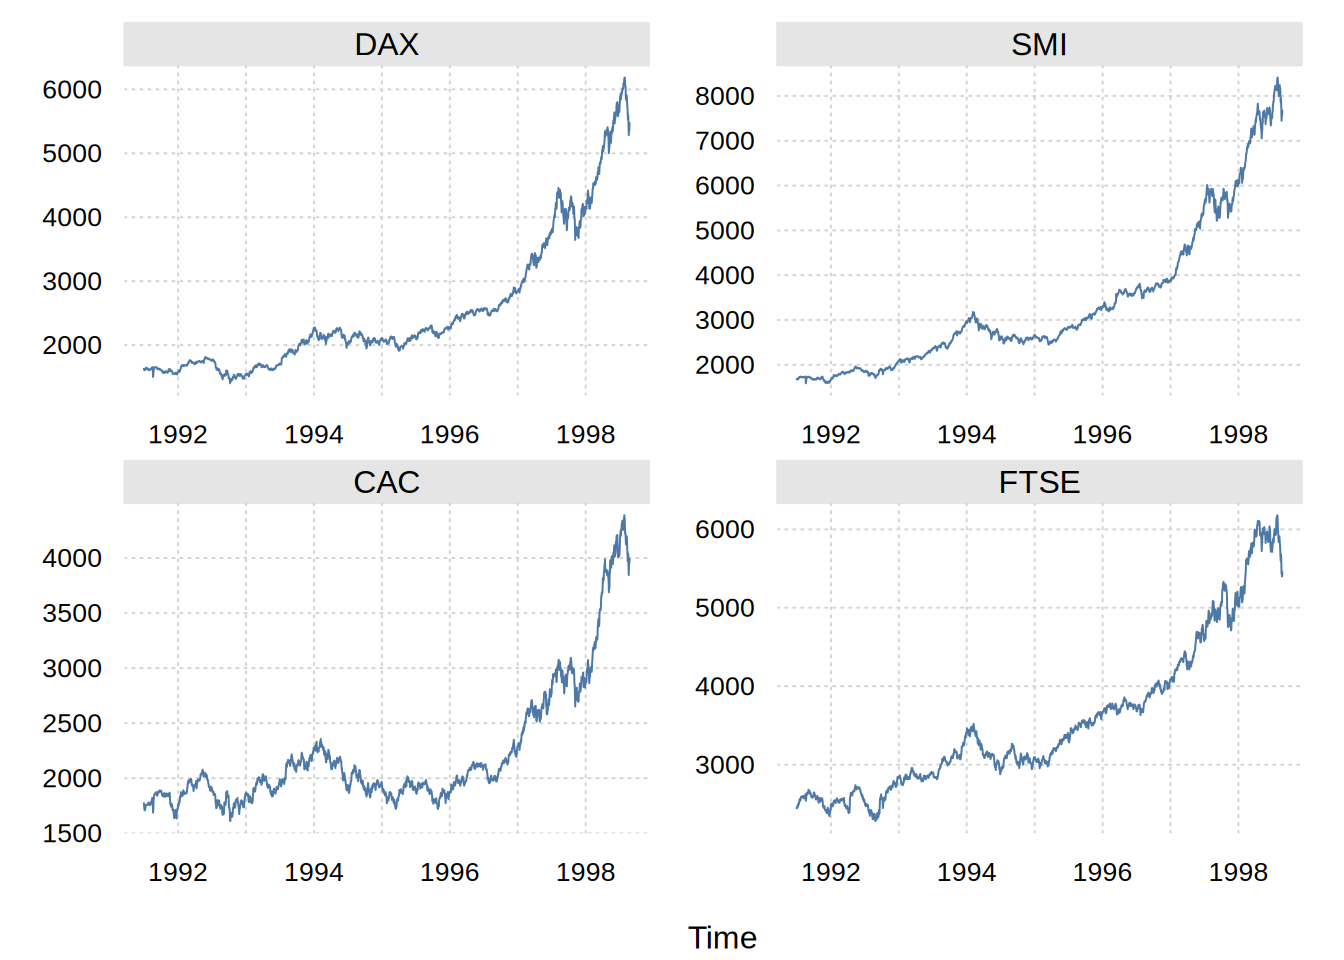
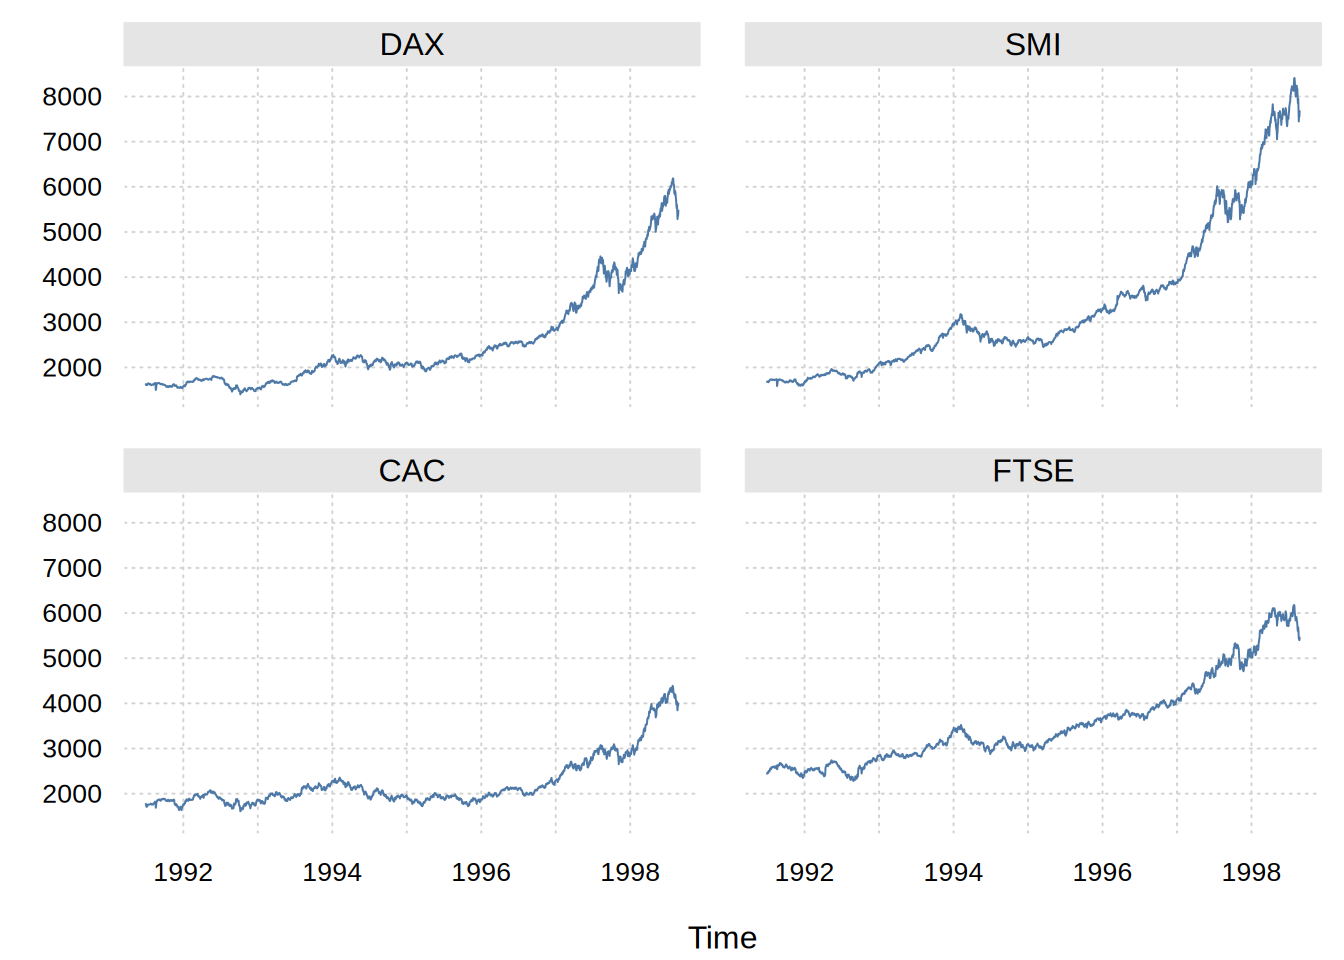
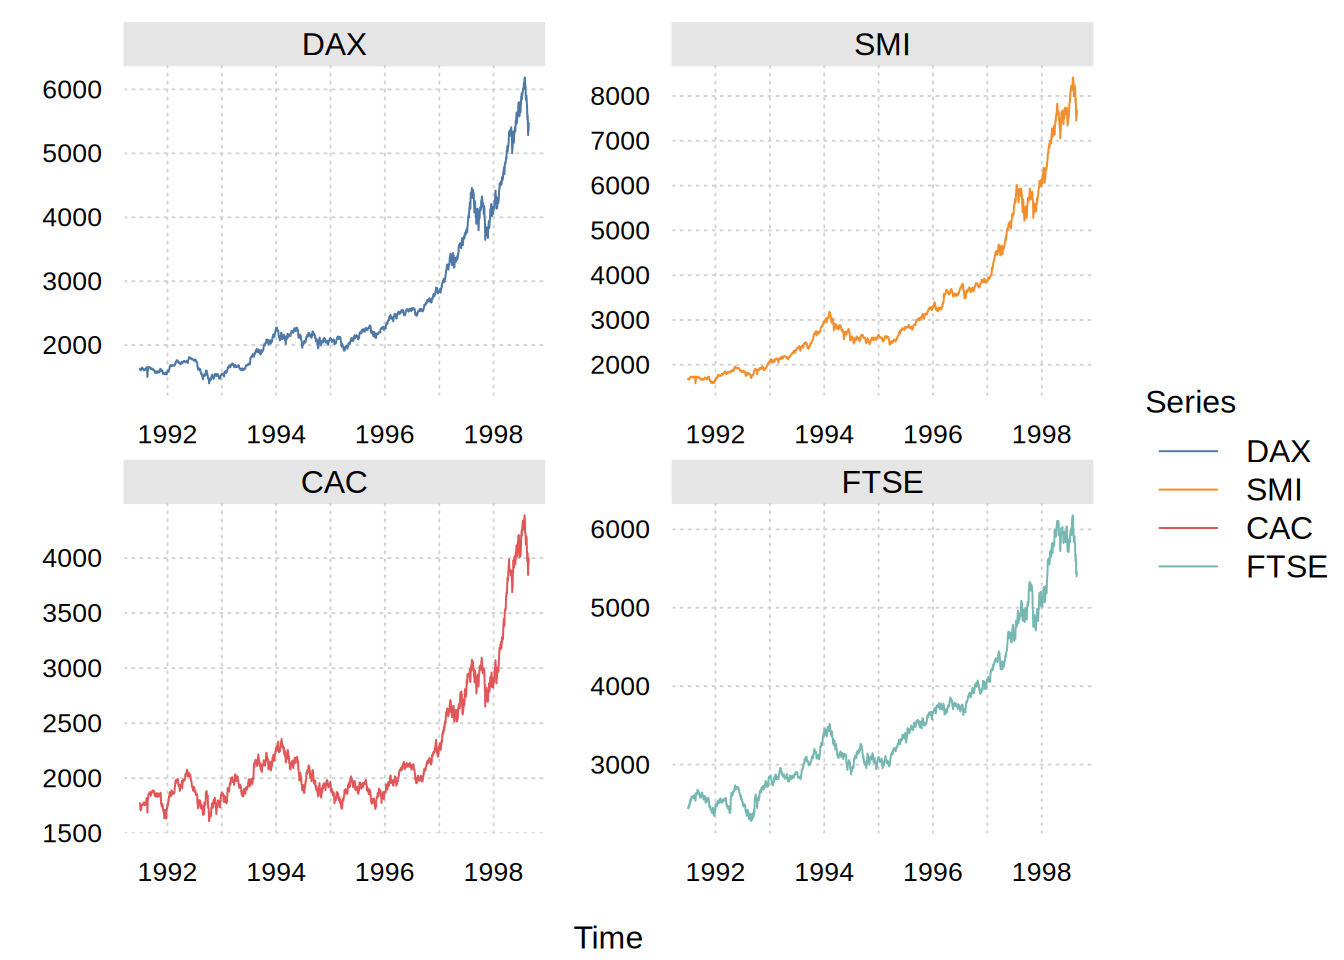
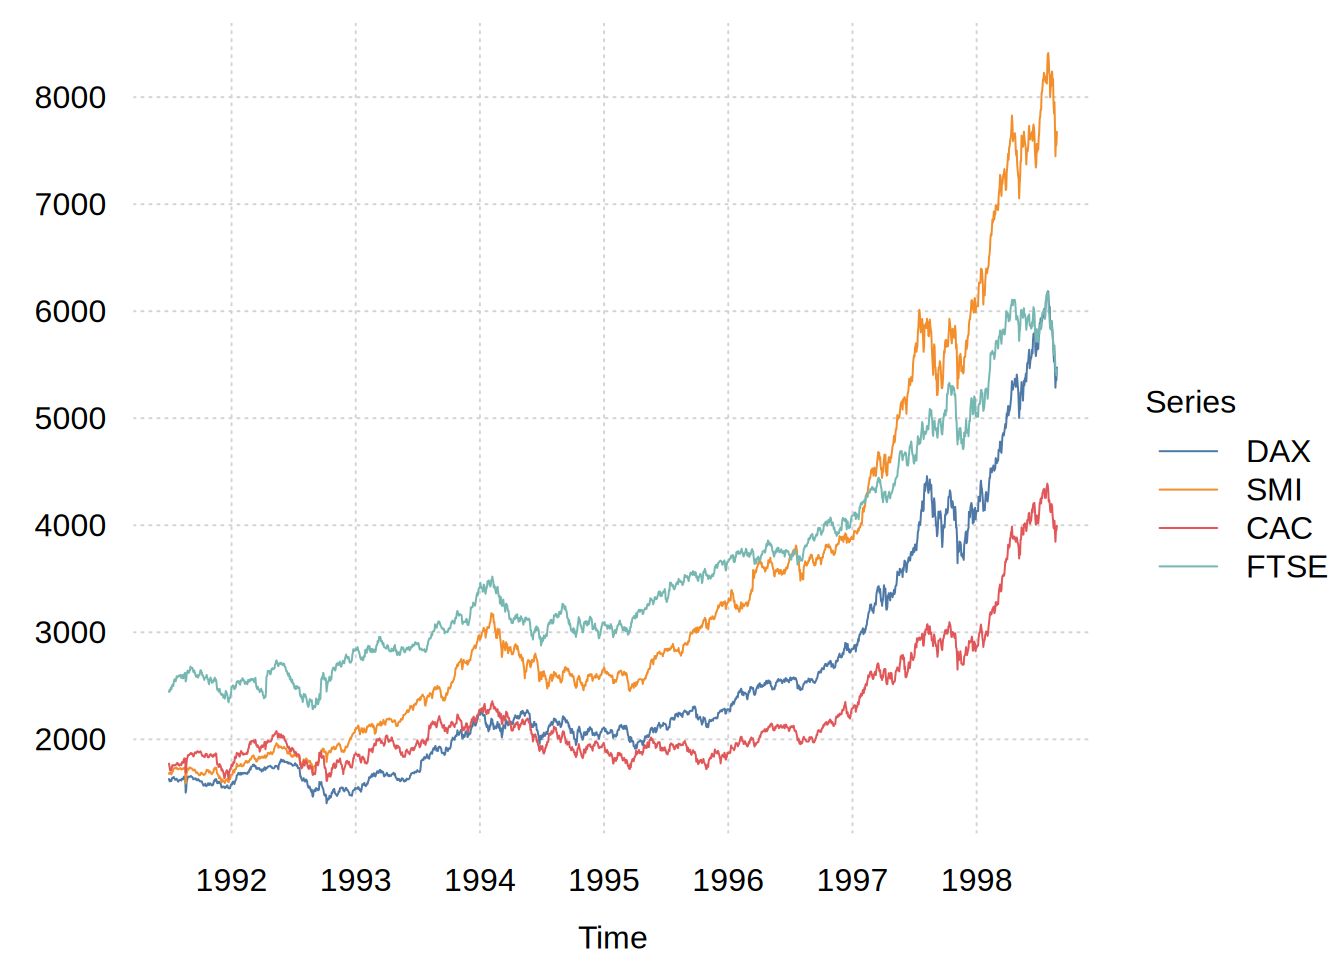
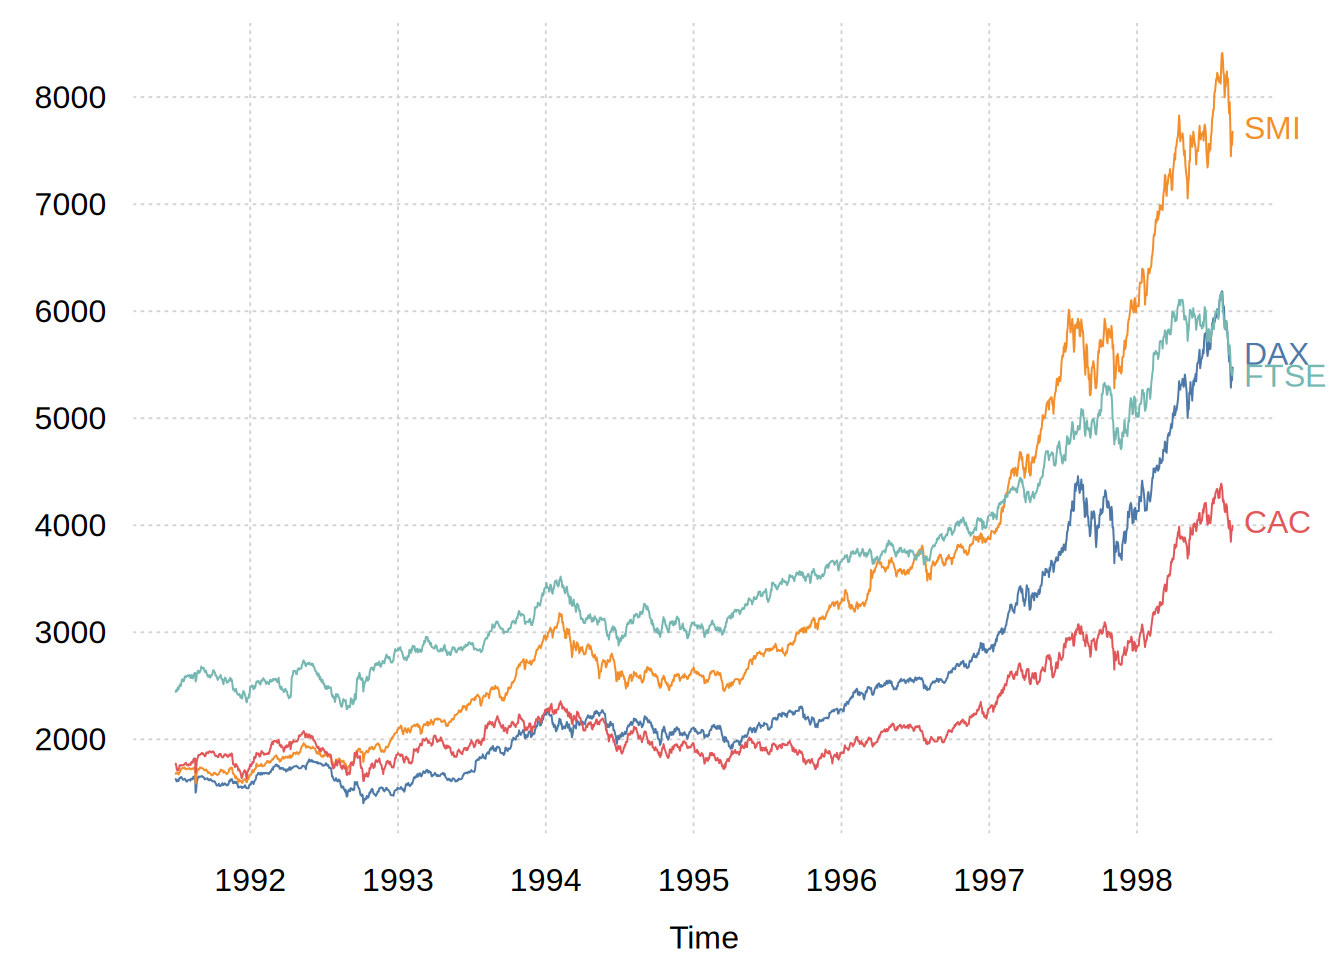
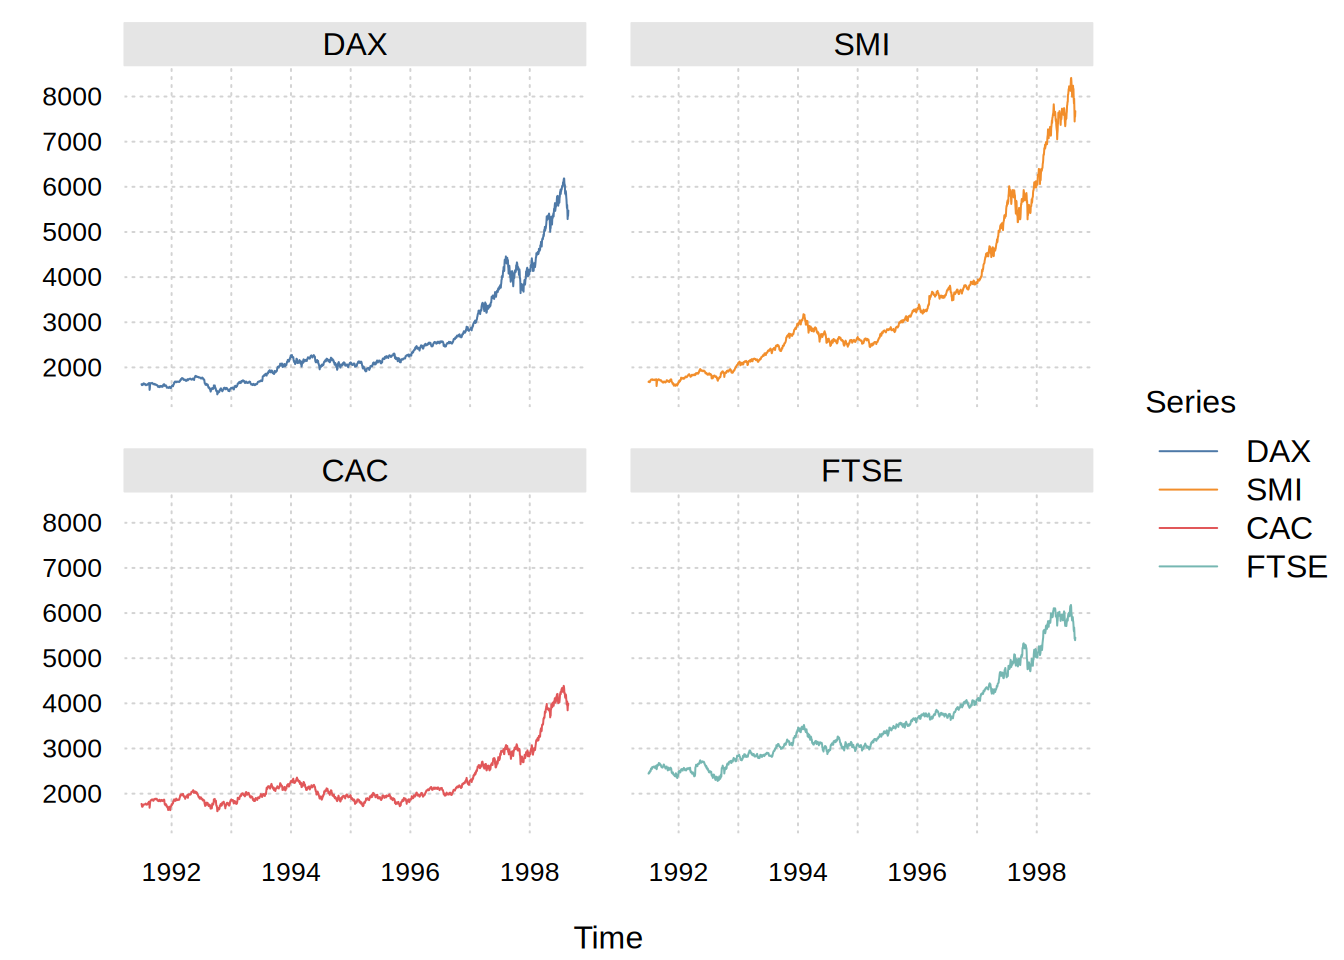
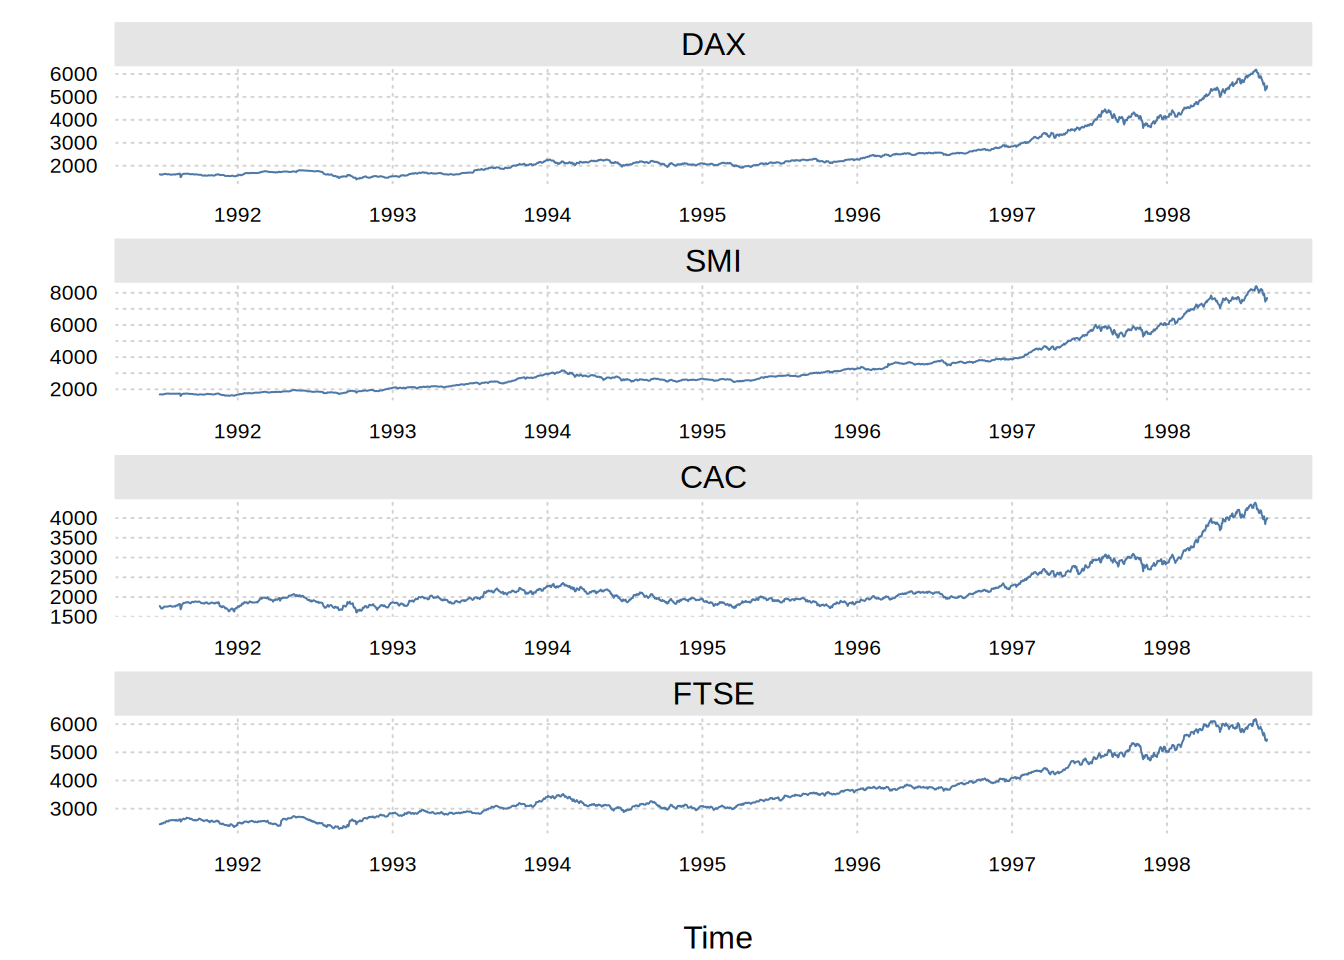
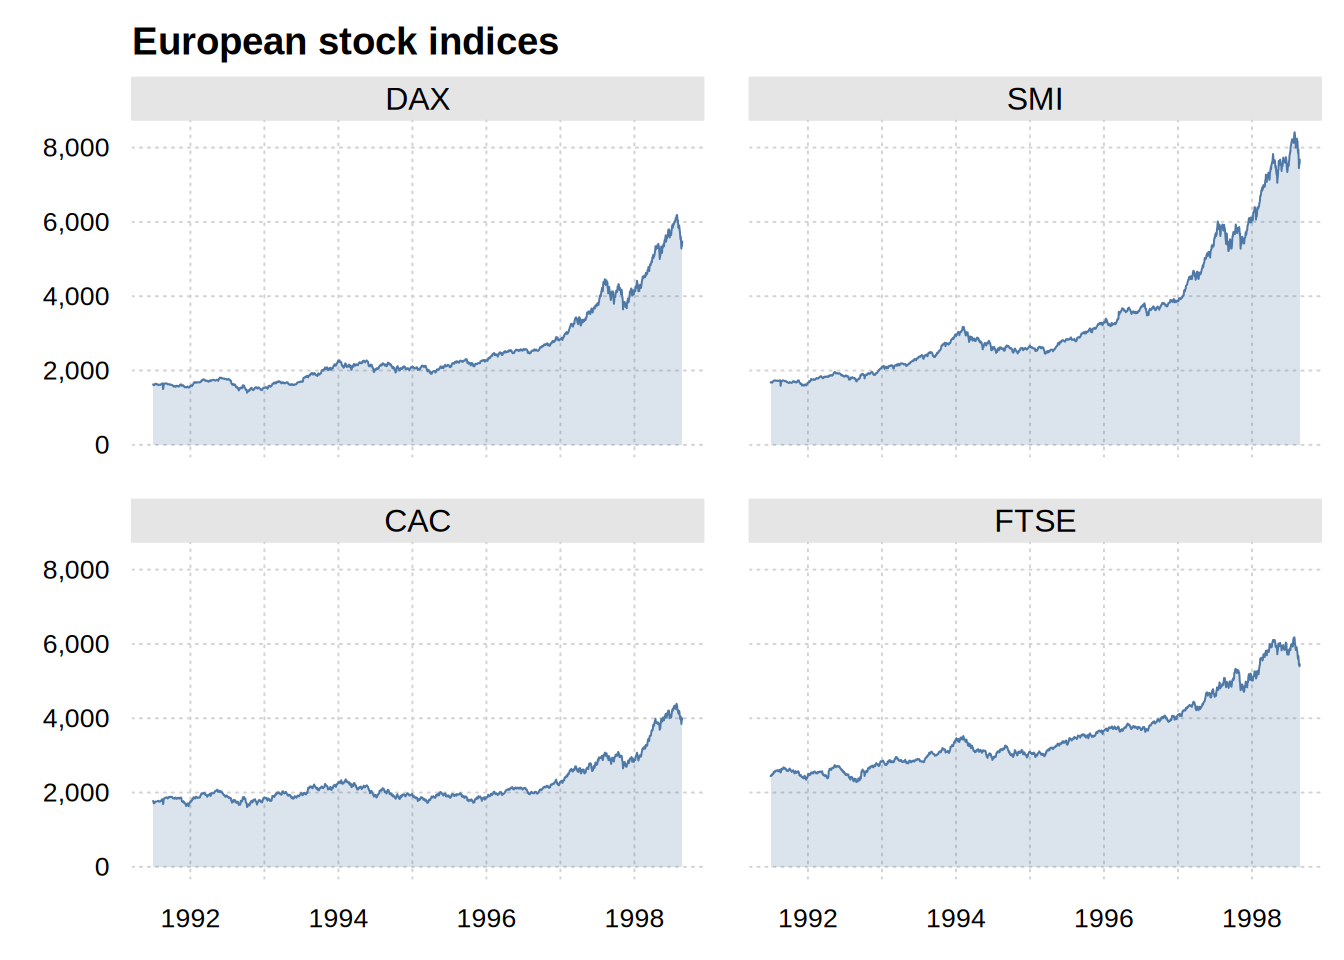
Internally the time series object is converted to a long data frame with columns Time (time index), Value (observations), and Series (factor with column labels). Depending on the settings of facet this data frame is visualized either with the formula Value ~ Time or Value ~ Time | Series. See the facet argument description for more details and the Examples below for some illustrations.
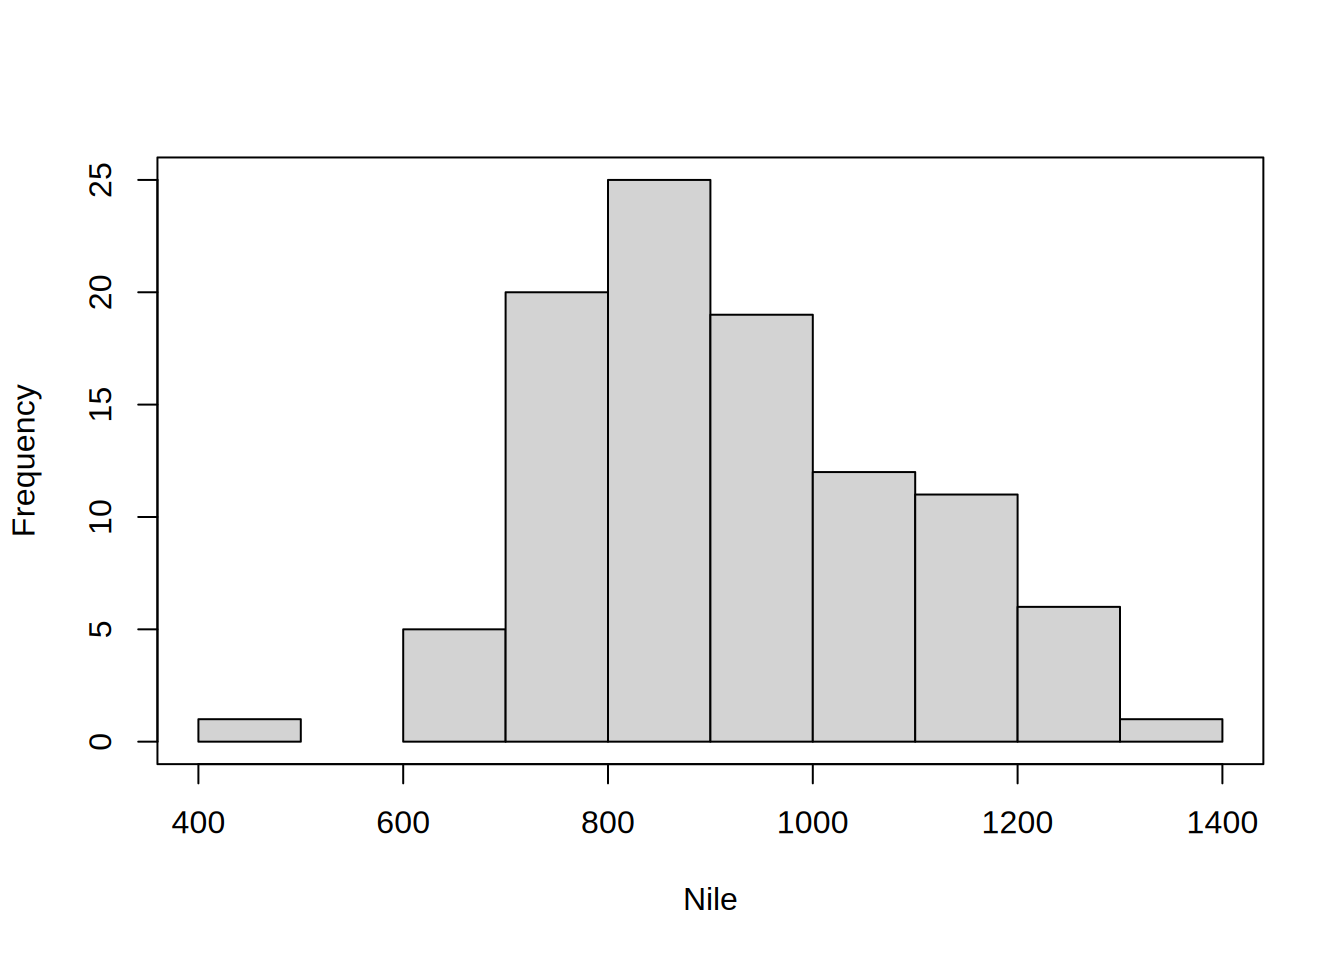
An exception is made if the user explicitly supplies a distribution type argument (i.e, one of “histogram”, “density”, “boxplot”, “violin”, “qq”, “ridge”, or “rug”). These summarize the series values and ignore the time index, so they are visualized with the one-sided formula ~ Value (or ~ Value | Series for multivariate series). This preserves base-R-compatible behaviour such as tinyplot(Nile, type = “histogram”).