library("tinyplot")
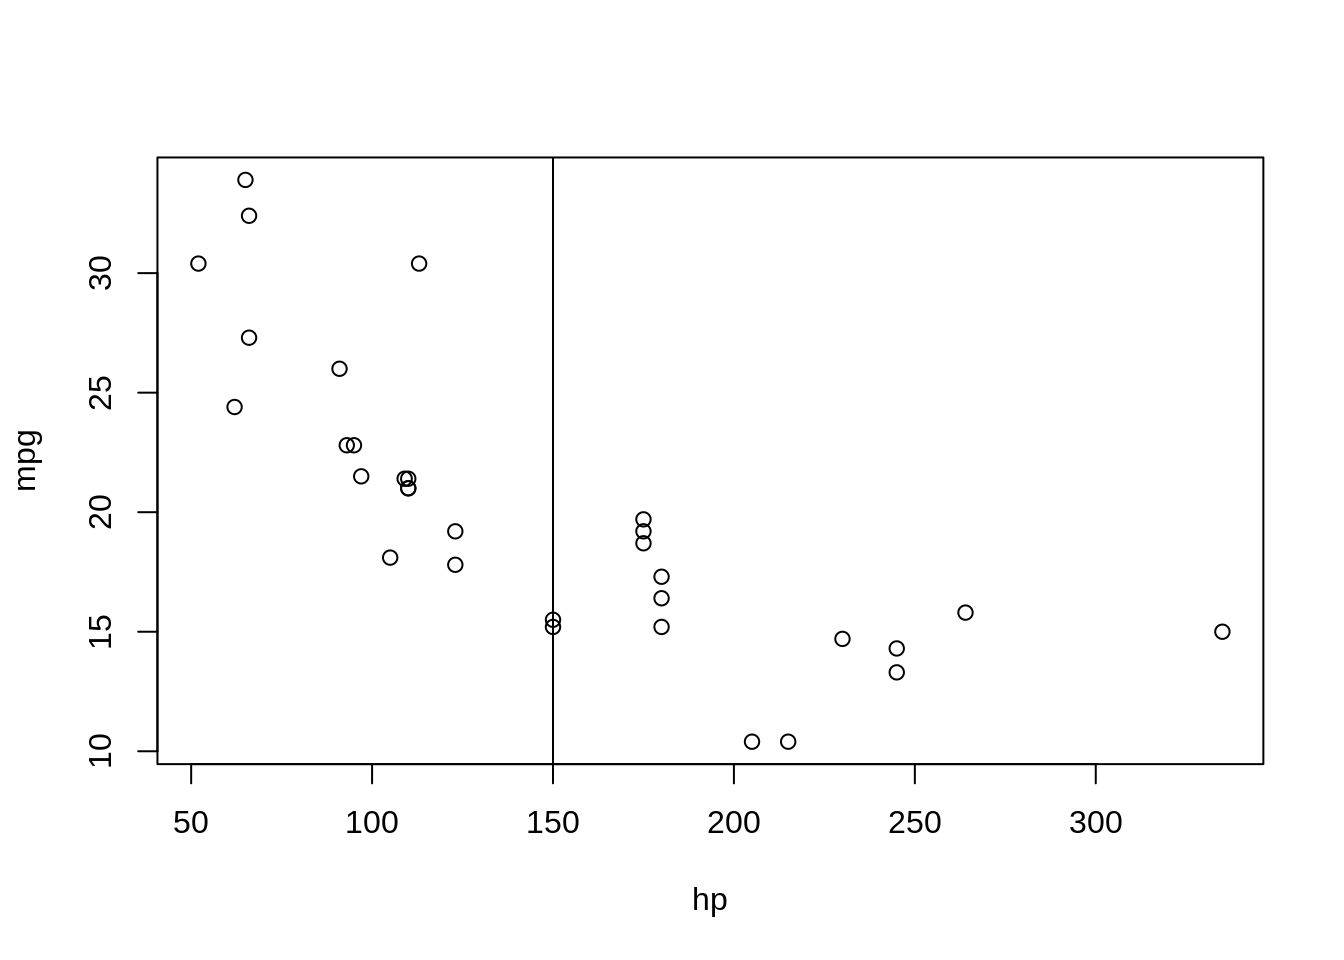
tinyplot(mpg ~ hp, data = mtcars)
tinyplot_add(type = type_vline(150))
# facet-specify location and colors
cols = c("black", "green", "orange")
tinyplot(mpg ~ hp | factor(cyl), facet = ~ factor(cyl), data = mtcars, col = cols)
tinyplot_add(type = type_vline(v = c(100, 150, 200)), lty = 3, lwd = 3)