Visualize simple 2-D decision tree partitions in R. The parttree package provides visualization methods for both base R graphics (via tinyplot) and ggplot2.
Installation
The stable version of parttree is available on CRAN.
install.packages("parttree")Or, you can grab the latest development version from R-universe.
install.packages("parttree", repos = "https://grantmcdermott.r-universe.dev")Quickstart
The parttree homepage includes an introductory vignette and detailed documentation. But here’s a quickstart example using the “kyphosis” dataset that comes bundled with the rpart package. In this case, we are interested in predicting kyphosis recovery after spinal surgery, as a function of 1) the number of topmost vertebra that were operated, and 2) patient age.
The key function is parttree(), which comes with its own plotting method.
library(rpart)     # For the dataset and fitting decisions trees
library(parttree)  # This package

fit = rpart(Kyphosis ~ Start + Age, data = kyphosis)

# Grab the partitions and plot
fit_pt = parttree(fit)
plot(fit_pt)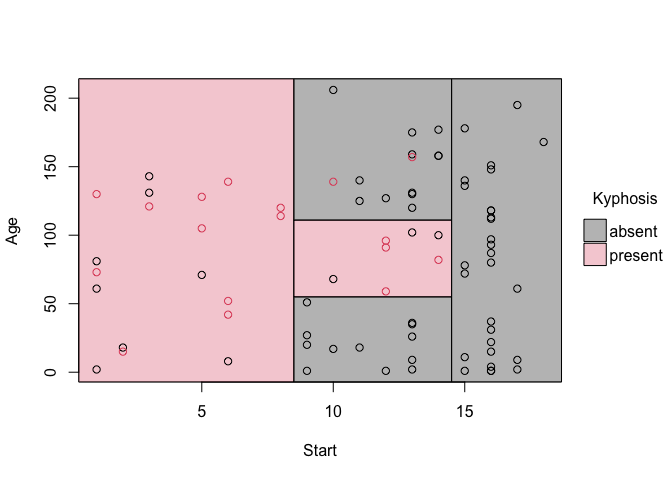
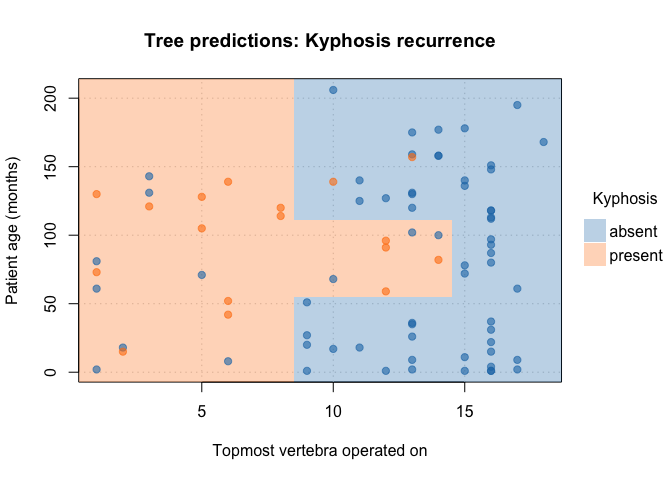
Customize your plots by passing additional arguments:
plot(
   fit_pt,
   border  = NA,                                     # no partition borders
   pch     = 19,                                     # filled points
   alpha   = 0.6,                                    # point transparency
   grid    = TRUE,                                   # background grid
   palette = "classic",                              # new colour palette
   xlab    = "Topmost vertebra operated on",         # custom x title
   ylab    = "Patient age (months)",                 # custom y title
   main    = "Tree predictions: Kyphosis recurrence" # custom title
)
ggplot2
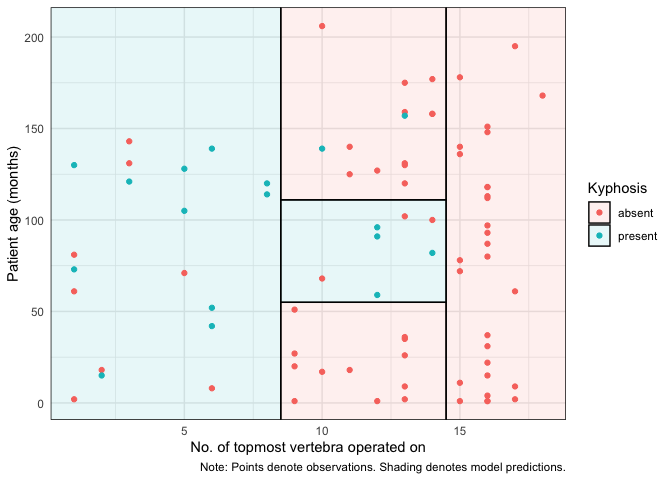
For ggplot2 users, we offer an equivalent workflow via the geom_partree() visualization layer.
library(ggplot2) ## Should be loaded separately

ggplot(kyphosis, aes(x = Start, y = Age)) +
  geom_parttree(data = fit, alpha = 0.1, aes(fill = Kyphosis)) + # <-- key layer
  geom_point(aes(col = Kyphosis)) +
  labs(
    x = "No. of topmost vertebra operated on", y = "Patient age (months)",
    caption = "Note: Points denote observations. Shading denotes model predictions."
    ) +
  theme_minimal()