Nice plots of your ritest objects.
Arguments
- x
An ritest object.
- type
Character. What type of plot do you want?
- highlight
Character. How do you want to highlight the H0 rejection regions in the distribution tails?
- show_parm
Logical. Should we highlight the parametric H0 rejection regions too?
- breaks
Character. Histogram plot only. What type of breaks do you want? The default method creates more breaks than the standard R behaviour. You can revert to the latter by selecting NULL.
- family
Character. The font family. Defaults to 'HersheySans' instead of R's normal Arial plotting font.
- ...
Other plot arguments. Currently ignored.
Examples
#
## Example 1: Basic functionality
#
# First estimate a simple linaer regression on the base 'npk' dataset. For
# this first example, we won't worry about strata or clusters, or other
# experimental design complications.
est = lm(yield ~ N + P + K, data = npk)
# Conduct RI on the 'N' (i.e. nitrogen) coefficient. We'll do 1,000
# simulations and, just for illustration, limit the number of parallel cores
# to 2 (default is half of the available cores). The 'verbose = TRUE'
# argument simply prints the results upon completion, including the original
# regression model summary.
est_ri = ritest(est, 'N', reps = 1e3, seed = 1234L, verbose = TRUE)
#>
#> Running 1000 parallel RI simulations as forked processes across 2 CPU cores.
#>
#> ******************
#> * ORIGINAL MODEL *
#> ******************
#>
#> Call:
#> lm(formula = yield ~ N + P + K, data = npk)
#>
#> Residuals:
#> Min 1Q Median 3Q Max
#> -9.2667 -3.6542 0.7083 3.4792 9.3333
#>
#> Coefficients:
#> Estimate Std. Error t value Pr(>|t|)
#> (Intercept) 54.650 2.205 24.784 <2e-16 ***
#> N1 5.617 2.205 2.547 0.0192 *
#> P1 -1.183 2.205 -0.537 0.5974
#> K1 -3.983 2.205 -1.806 0.0859 .
#> ---
#> Signif. codes: 0 ‘***’ 0.001 ‘**’ 0.01 ‘*’ 0.05 ‘.’ 0.1 ‘ ’ 1
#>
#> Residual standard error: 5.401 on 20 degrees of freedom
#> Multiple R-squared: 0.3342, Adjusted R-squared: 0.2343
#> F-statistic: 3.346 on 3 and 20 DF, p-value: 0.0397
#>
#>
#> ******************
#> * RITEST RESULTS *
#> ******************
#>
#> Call: lm(formula = yield ~ N + P + K, data = npk)
#> Res. var(s): N1
#> H0: N1=0
#> Num. reps: 1000
#> ────────────────────────────────────────────────────────────────────────────────
#> T(obs) c n p=c/n SE(p) CI 2.5% CI 97.5%
#> 5.617 21 1000 0.021 0.007462 0.008726 0.03327
#> ────────────────────────────────────────────────────────────────────────────────
#> Note: Confidence interval is with respect to p=c/n.
#> Note: c = #{|T| >= |T(obs)|}
#>
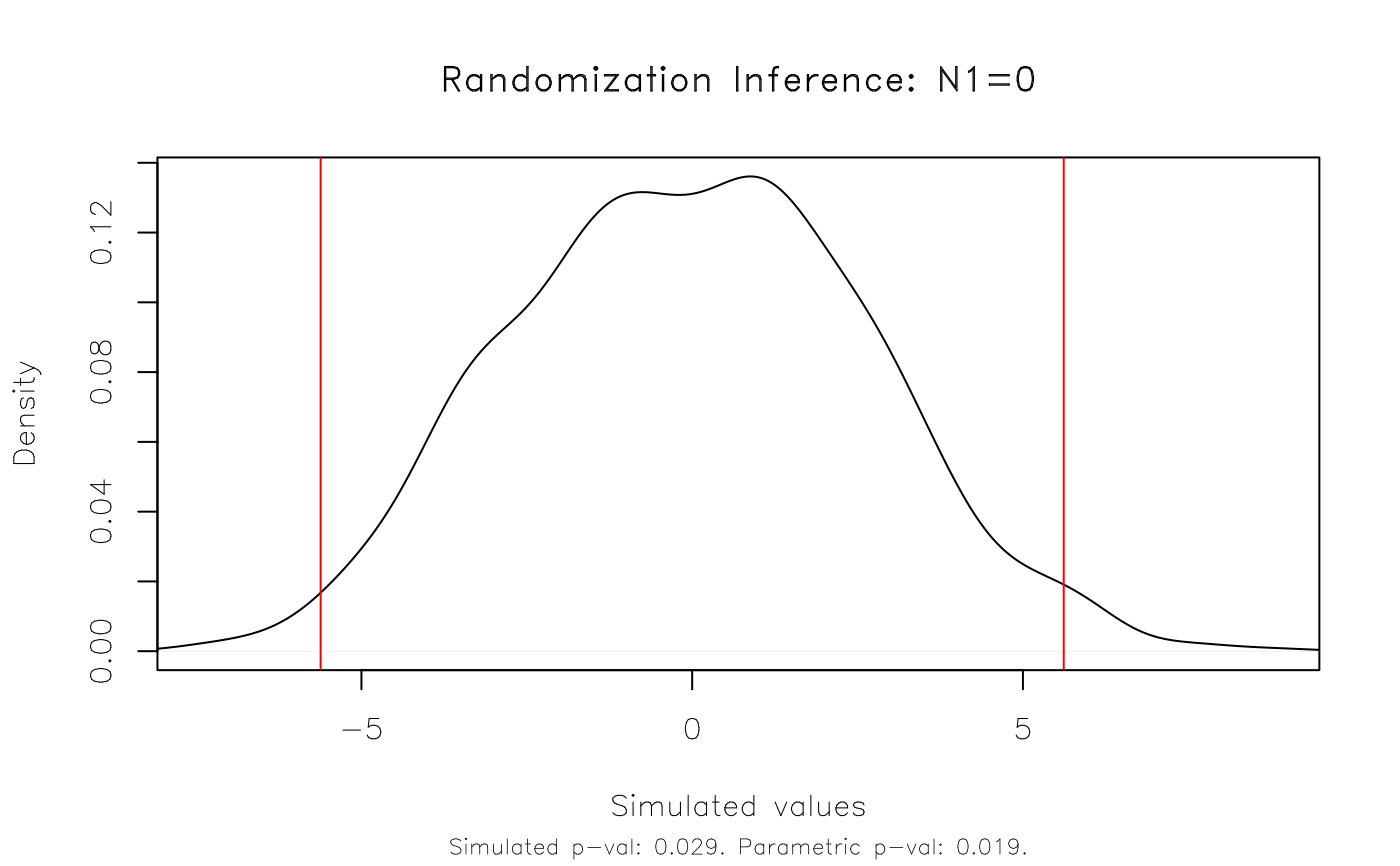
# Result: The RI rejection rate (0.021) is very similar to the parametric
# p-value (0.019).
# We can plot the results and various options are available to customise the appearance.
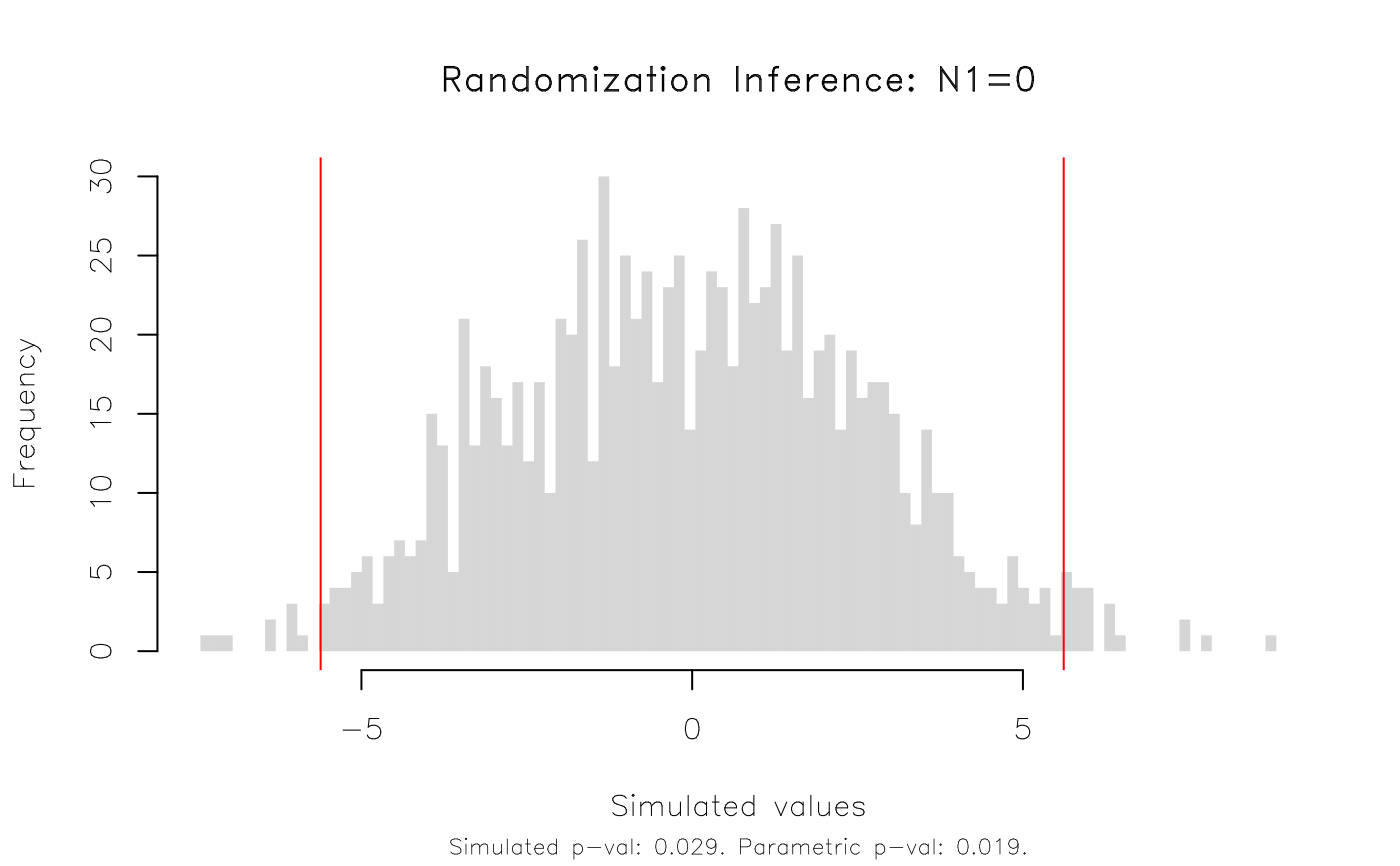
plot(est_ri)
 plot(est_ri, type = 'hist')
 # etc
# Aside: By default, ritest() conducts a standard two-sided test against a
# sharp null hypothesis of zero. You can can specify other null hypotheses as
# part of the 'resampvar' string argument. For example, a (left) one-sided
# test...
plot(ritest(est, 'N<=0', reps = 1e3, seed = 1234L, pcores = 2L))
# etc
# Aside: By default, ritest() conducts a standard two-sided test against a
# sharp null hypothesis of zero. You can can specify other null hypotheses as
# part of the 'resampvar' string argument. For example, a (left) one-sided
# test...
plot(ritest(est, 'N<=0', reps = 1e3, seed = 1234L, pcores = 2L))
 # ... or, null values different from zero.
plot(ritest(est, 'N=2', reps = 1e3, seed = 1234L, pcores = 2L))
# ... or, null values different from zero.
plot(ritest(est, 'N=2', reps = 1e3, seed = 1234L, pcores = 2L))
 #
## Example 2: Real-life example
#
# Now that we've seen the basic functionality, here's a more realistic RI
# example using data from a randomized control trial conducted in Colombia.
# More details on the dataset -- kindly provided by the study authors -- can
# be found in the accompanying helpfile ("?colombia"). The most important
# thing to note is that we need to control for the stratified (aka "blocked")
# and clustered experimental design.
data("colombia")
# We'll use the fixest package to estimate our parametric regression model,
# specifying the strata (here: treatment-control pairs) as fixed-effects and
# clustering the standard errors by location (here: city blocks).
library(fixest)
co_est = feols(dayscorab ~ b_treat + b_dayscorab + miss_b_dayscorab |
b_pair + round2 + round3,
vcov = ~b_block, data = colombia)
#> NOTE: 1,020 observations removed because of NA values (LHS: 1,020).
co_est
#> OLS estimation, Dep. Var.: dayscorab
#> Observations: 2,346
#> Fixed-effects: b_pair: 31, round2: 2, round3: 2
#> Standard-errors: Clustered (b_block)
#> Estimate Std. Error t value Pr(>|t|)
#> b_treat -0.180738 0.078174 -2.31201 0.024113 *
#> b_dayscorab 0.524761 0.029423 17.83478 < 2.2e-16 ***
#> miss_b_dayscorab 0.603928 0.264174 2.28610 0.025678 *
#> ---
#> Signif. codes: 0 '***' 0.001 '**' 0.01 '*' 0.05 '.' 0.1 ' ' 1
#> RMSE: 1.91167 Adj. R2: 0.282038
#> Within R2: 0.266002
# Run RI on the 'b_treat' variable, specifying the strata and clusters.
# All three input styles work: bare names, strings, or formulas.
co_ri = ritest(co_est, b_treat, strata = b_pair, cluster = b_block,
reps=1e3, seed=123L)
co_ri
#>
#> Call: feols(fml = dayscorab ~ b_treat + b_dayscorab + miss_b_dayscorab | b_pair + round2 + round3, data = colombia, vcov = ~b_block)
#> Res. var(s): b_treat
#> H0: b_treat=0
#> Strata var(s): b_pair
#> Strata: 31
#> Cluster var(s): b_block
#> Clusters: 63
#> Num. reps: 1000
#> ────────────────────────────────────────────────────────────────────────────────
#> T(obs) c n p=c/n SE(p) CI 2.5% CI 97.5%
#> -0.1807 110 1000 0.11 0.01628 0.08322 0.1368
#> ────────────────────────────────────────────────────────────────────────────────
#> Note: Confidence interval is with respect to p=c/n.
#> Note: c = #{|T| >= |T(obs)|}
#>
plot(co_ri, type = 'hist', highlight = 'fill')
#
## Example 2: Real-life example
#
# Now that we've seen the basic functionality, here's a more realistic RI
# example using data from a randomized control trial conducted in Colombia.
# More details on the dataset -- kindly provided by the study authors -- can
# be found in the accompanying helpfile ("?colombia"). The most important
# thing to note is that we need to control for the stratified (aka "blocked")
# and clustered experimental design.
data("colombia")
# We'll use the fixest package to estimate our parametric regression model,
# specifying the strata (here: treatment-control pairs) as fixed-effects and
# clustering the standard errors by location (here: city blocks).
library(fixest)
co_est = feols(dayscorab ~ b_treat + b_dayscorab + miss_b_dayscorab |
b_pair + round2 + round3,
vcov = ~b_block, data = colombia)
#> NOTE: 1,020 observations removed because of NA values (LHS: 1,020).
co_est
#> OLS estimation, Dep. Var.: dayscorab
#> Observations: 2,346
#> Fixed-effects: b_pair: 31, round2: 2, round3: 2
#> Standard-errors: Clustered (b_block)
#> Estimate Std. Error t value Pr(>|t|)
#> b_treat -0.180738 0.078174 -2.31201 0.024113 *
#> b_dayscorab 0.524761 0.029423 17.83478 < 2.2e-16 ***
#> miss_b_dayscorab 0.603928 0.264174 2.28610 0.025678 *
#> ---
#> Signif. codes: 0 '***' 0.001 '**' 0.01 '*' 0.05 '.' 0.1 ' ' 1
#> RMSE: 1.91167 Adj. R2: 0.282038
#> Within R2: 0.266002
# Run RI on the 'b_treat' variable, specifying the strata and clusters.
# All three input styles work: bare names, strings, or formulas.
co_ri = ritest(co_est, b_treat, strata = b_pair, cluster = b_block,
reps=1e3, seed=123L)
co_ri
#>
#> Call: feols(fml = dayscorab ~ b_treat + b_dayscorab + miss_b_dayscorab | b_pair + round2 + round3, data = colombia, vcov = ~b_block)
#> Res. var(s): b_treat
#> H0: b_treat=0
#> Strata var(s): b_pair
#> Strata: 31
#> Cluster var(s): b_block
#> Clusters: 63
#> Num. reps: 1000
#> ────────────────────────────────────────────────────────────────────────────────
#> T(obs) c n p=c/n SE(p) CI 2.5% CI 97.5%
#> -0.1807 110 1000 0.11 0.01628 0.08322 0.1368
#> ────────────────────────────────────────────────────────────────────────────────
#> Note: Confidence interval is with respect to p=c/n.
#> Note: c = #{|T| >= |T(obs)|}
#>
plot(co_ri, type = 'hist', highlight = 'fill')
 # This time, the RI rejection rate (0.11) is noticeably higher than the
# parametric p-value (0.024) from the regression model.
# This time, the RI rejection rate (0.11) is noticeably higher than the
# parametric p-value (0.024) from the regression model.